

Question: answer q4 using q2 Q2: Suppose in an industrial experiment that an engineer is interested in how the mean absorption of moisture in concrete varies
answer q4 using q2
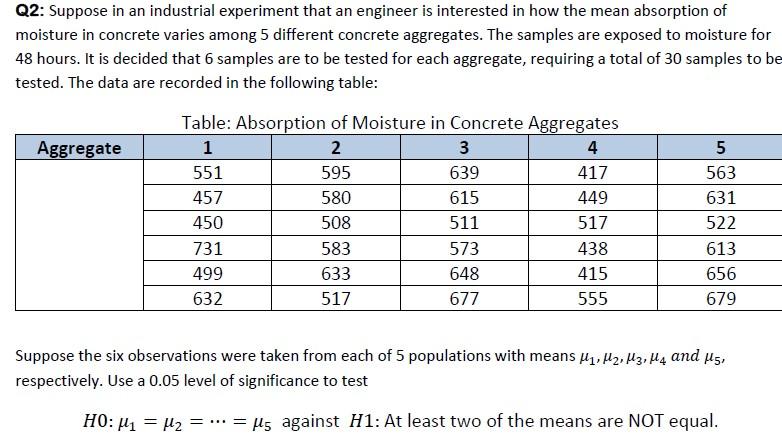
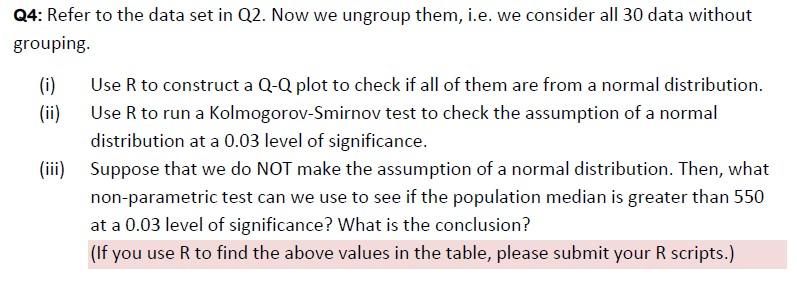
Q2: Suppose in an industrial experiment that an engineer is interested in how the mean absorption of moisture in concrete varies among 5 different concrete aggregates. The samples are exposed to moisture for 48 hours. It is decided that 6 samples are to be tested for each aggregate, requiring a total of 30 samples to be tested. The data are recorded in the following table: Aggregate Table: Absorption of Moisture in Concrete Aggregates 1 2 3 4 551 595 639 417 457 580 615 449 450 508 511 517 731 583 573 438 499 633 648 415 632 517 677 555 5 563 631 522 613 656 679 Suppose the six observations were taken from each of 5 populations with means M1, M2, M3, M4 and us, respectively. Use a 0.05 level of significance to test HO: 1 = H2 = ... = ls against H1: At least two of the means are NOT equal. Q4: Refer to the data set in Q2. Now we ungroup them, i.e. we consider all 30 data without grouping. (i) Use R to construct a Q-Q plot to check if all of them are from a normal distribution. (ii) Use R to run a Kolmogorov-Smirnov test to check the assumption of a normal distribution at a 0.03 level of significance. (iii) Suppose that we do NOT make the assumption of a normal distribution. Then, what non-parametric test can we use to see if the population median is greater than 550 at a 0.03 level of significance? What is the conclusion? (If you use R to find the above values in the table, please submit your R scripts.)Step by Step Solution
There are 3 Steps involved in it
1 Expert Approved Answer
Step: 1 Unlock

Question Has Been Solved by an Expert!
Get step-by-step solutions from verified subject matter experts
Step: 2 Unlock
Step: 3 Unlock