

Question: answer question 3 according to the 6.5 figure below Customer_ID Name Salesperson Region 8023 Anderson Smith South 9167 Bancroft Hicks West 7924 Hobbs Smith South
answer question 3 according to the 6.5 figure below
| Customer_ID | Name | Salesperson | Region |
| 8023 | Anderson | Smith | South |
| 9167 | Bancroft | Hicks | West |
| 7924 | Hobbs | Smith | South |
| 6837 | Tucker | Hernandez | East |
| 8596 | Eckersley | Hicks | West |
| 7018 | Arnold | Faulb | North |
3) Normalize the table so that there are no more partial and/or transitive dependencies, and draw the new
dependency diagrams for the normal form. Yours looks like the one in Figure 6.5. Again include both diagram and textual notation.
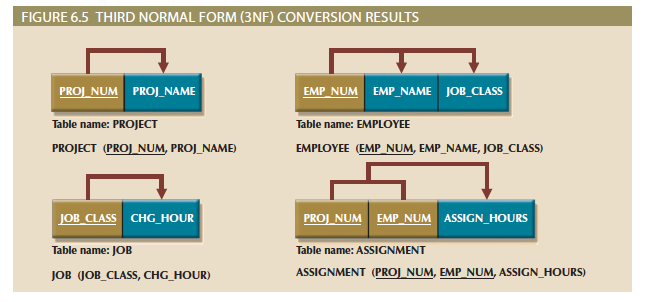
FIGURE 6.5 THIRD NORMAL FORM (3NF) CONVERSION RESULTS PROI NUM PRO NAME Table name: PROJECT PROJECT PROJ NUM, PROJ NAME EMP NUM EMP_NAME JOB_CLASS Table name: EMPLOYEE EMPLOYEE (EMP NUM, EMP NAME, IOB CLASS) JOB CLASS CHG HOUR Table name: JOB JOB IOB CLASS, CHG HOUR) PROI NUM EMP NUM ASSIGN HOURS Table name: ASSIGNMENT ASSIGNMENT (PROJ NUM, EMP NUM, ASSIGN HOURS)
Step by Step Solution
There are 3 Steps involved in it

Get step-by-step solutions from verified subject matter experts