

Question: answer question 3 and 4 only Every group should submit one excel file containing the complete answer. The objective of the lab assignment is to
 answer question 3 and 4 only
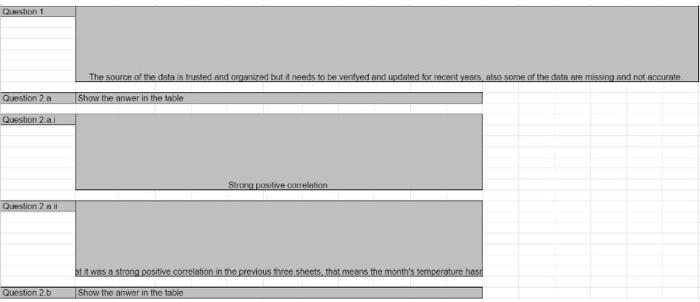
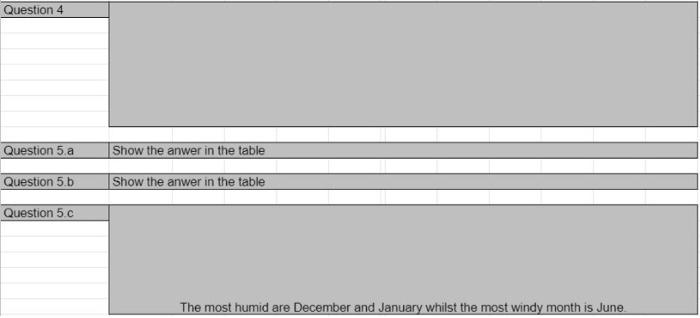
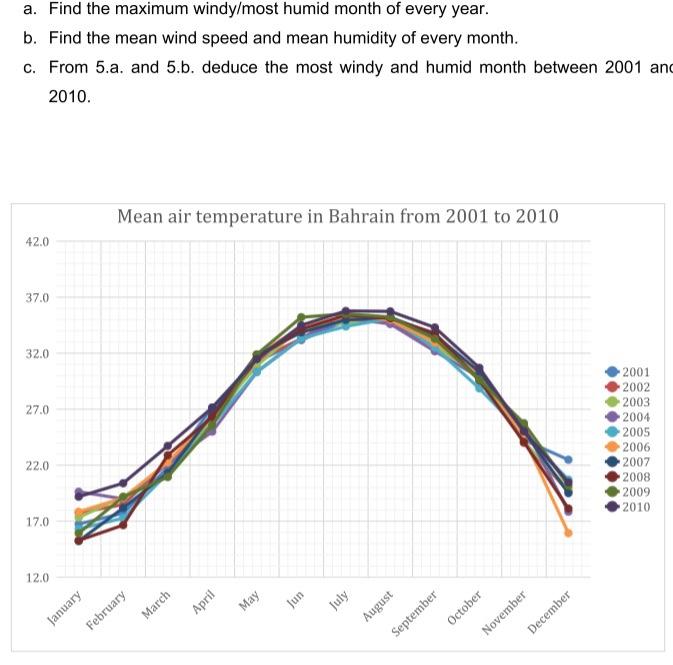
Every group should submit one excel file containing the complete answer. The objective of the lab assignment is to analyze the data summarized in the file Bahrain weather.xls containing five excel sheets that summarize 10-years Bahrain weather data for the period 2001-2010. The data consists of monthly: Mean air temperature - Maximum temperature - Minimum temperature Relative humidity Wind speed 1. What do you think about the data quality (source, completeness, etc.). 2. For the first three sheets, use excel predefined function to: a. Find the correlation coefficient between the monthly temperature of every two successive years (2001, 2002), (2002, 2003), ..., (2009, 2010). i. Which type of correlation do you get for every couple of years? ii. Compare the different correlation coefficients you obtain in the three sheets? What do you notice? b. Find the correlation coefficient between the monthly temperature of the years (2001, 2010). i. Which type of correlation do you get? ii. Is there a difference between the correlation coefficients you obtained in 2.a. and in 2.b. 3. For the first three sheets representing the monthly mean air temperature, monthly maximum temperature, monthly minimum temperature, draw a line graph including all the monthly temperatures for the ten years (see graph given below). Comment the shape of every obtained graph. 4. What is better to analyze the ten-year temperature scheme, correlation coefficients or graphs? 5. For the last two sheets representing the monthly relative mean humidity and mean wind speed: a. Find the maximum windy/most humid month of every year. b. Find the mean wind speed and mean humidity of every month. c. From 5.a. and 5.b. deduce the most windy and humid month between 2001 and 2010. Mean air temperature in Bahrain from 2001 to 2010 42.0 37.0 32.0 27.0 2001 2002 2003 2004 2005 2006 2007 2008 2009 2010 22.0 17.0 12.0 April May July January August September October November December February March Question 1 The source of the data is trusted and organized but it needs to be verifyed and updated for recent years also some of the data are missing and not accurate Question 2 a Show the anwer in the table Question 2 ai Strong positive contention Question 2 bt was strong positive correlation in the previous three sheets, that means the month's temperature hose Question 2.b Show the anwer in the table Question 4 Question 5. a Show the anwer in the table Question 5.b Show the anwer in the table Question 5.0 The most humid are December and January whilst the most windy month is June Question 2.b Show the anwer in the table Question 2 bi Strong positive correlation Question 2.b.ii tion coefficients that are all strong positive correlations as in 2a, but they are slightly greater due to some te Show the line graph anwer in the sheet Question 3 Question 3 comments Every group should submit one excel file containing the complete answer. The objective of the lab assignment is to analyze the data summarized in the file Bahrain weather.xls containing five excel sheets that summarize 10-years Bahrain weather data for the period 2001-2010. The data consists of monthly: Mean air temperature - Maximum temperature - Minimum temperature Relative humidity Wind speed 1. What do you think about the data quality (source, completeness, etc.). 2. For the first three sheets, use excel predefined function to: a. Find the correlation coefficient between the monthly temperature of every two successive years (2001, 2002), (2002, 2003), ..., (2009, 2010). i. Which type of correlation do you get for every couple of years? ii. Compare the different correlation coefficients you obtain in the three sheets? What do you notice? b. Find the correlation coefficient between the monthly temperature of the years (2001, 2010). i. Which type of correlation do you get? ii. Is there a difference between the correlation coefficients you obtained in 2.a. and in 2.b. 3. For the first three sheets representing the monthly mean air temperature, monthly maximum temperature, monthly minimum temperature, draw a line graph including all the monthly temperatures for the ten years (see graph given below). Comment the shape of every obtained graph. 4. What is better to analyze the ten-year temperature scheme, correlation coefficients or graphs? 5. For the last two sheets representing the monthly relative mean humidity and mean wind speed: a. Find the maximum windy/most humid month of every year. b. Find the mean wind speed and mean humidity of every month. c. From 5.a. and 5.b. deduce the most windy and humid month between 2001 and 2010. Mean air temperature in Bahrain from 2001 to 2010 42.0 37.0 32.0 27.0 2001 2002 2003 2004 2005 2006 2007 2008 2009 2010 22.0 17.0 12.0 April May July January August September October November December February March Question 1 The source of the data is trusted and organized but it needs to be verifyed and updated for recent years also some of the data are missing and not accurate Question 2 a Show the anwer in the table Question 2 ai Strong positive contention Question 2 bt was strong positive correlation in the previous three sheets, that means the month's temperature hose Question 2.b Show the anwer in the table Question 4 Question 5. a Show the anwer in the table Question 5.b Show the anwer in the table Question 5.0 The most humid are December and January whilst the most windy month is June Question 2.b Show the anwer in the table Question 2 bi Strong positive correlation Question 2.b.ii tion coefficients that are all strong positive correlations as in 2a, but they are slightly greater due to some te Show the line graph anwer in the sheet Question 3 Question 3 comments
Step by Step Solution
There are 3 Steps involved in it

Get step-by-step solutions from verified subject matter experts