

Question: answer question 3 and explain how you find observed frequency and what it would be for all of them I Calculate and record the observed
answer question 3 and explain how you find observed frequency and what it would be for all of them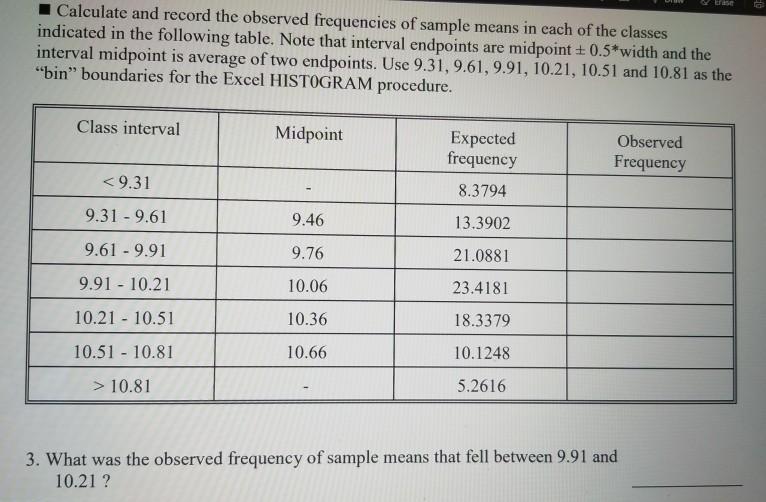
I Calculate and record the observed frequencies of sample means in cach of the classes indicated in the following table. Note that interval endpoints are midpoint + 0.5*width and the interval midpoint is average of two endpoints. Use 9.31, 9.61, 9.91, 10.21, 10.51 and 10.81 as the "bin" boundaries for the Excel HISTOGRAM procedure. trase Class interval Midpoint Expected frequency Observed Frequency < 9.31 8.3794 9.31 - 9.61 9.46 13.3902 9.61 - 9.91 9.76 21.0881 9.91 - 10.21 10.06 23.4181 10.21 10.51 10.36 18.3379 10.51 - 10.81 10.66 10.1248 > 10.81 5.2616 3. What was the observed frequency of sample means that fell between 9.91 and 10.21 ?
Step by Step Solution
3.44 Rating (160 Votes )
There are 3 Steps involved in it
To find the observed frequency of sample means that fell between 991 and 1021 we need the actual dat... View full answer

Get step-by-step solutions from verified subject matter experts