

Question: Answer question 5 using a programming language of your choice please provide your source code: Linear Regression In these problems, we will explore how Linear
Answer question 5 using a programming language of your choice please provide your source code:
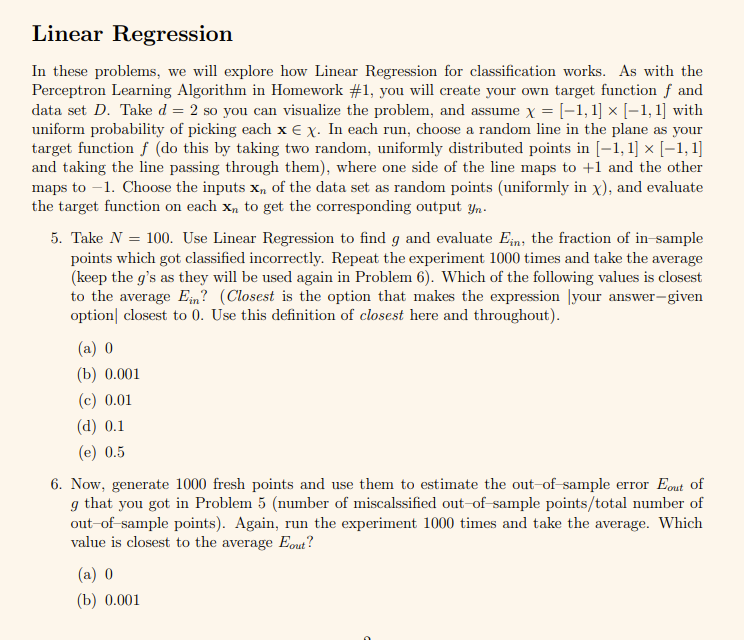
Linear Regression In these problems, we will explore how Linear Regression for classification works. As with the Perceptron Learning Algorithm in Homework #1, you will create your own target function f and data set D. Take d= 2 so you can visualize the problem, and assume x = (-1, 1] x [-1,1] with uniform probability of picking each xe x. In each run, choose a random line in the plane as your target function f (do this by taking two random, uniformly distributed points in [-1,1] x [-1,1] and taking the line passing through them), where one side of the line maps to +1 and the other maps to -1. Choose the inputs Xn of the data set as random points (uniformly in x), and evaluate the target function on each xn to get the corresponding output yn. 5. Take N = 100. Use Linear Regression to find g and evaluate Ein, the fraction of in-sample points which got classified incorrectly. Repeat the experiment 1000 times and take the average (keep the g's as they will be used again in Problem 6). Which of the following values is closest to the average Ein? (Closest is the option that makes the expression your answer-given option closest to 0. Use this definition of closest here and throughout). (a) 0 (b) 0.001 (c) 0.01 (d) 0.1 (e) 0.5 6. Now, generate 1000 fresh points and use them to estimate the out-of-sample error Eout of g that you got in Problem 5 (number of miscalssified out-of-sample points/total number of out-of sample points). Again, run the experiment 1000 times and take the average. Which value is closest to the average Eout? (a) o (b) 0.001 Linear Regression In these problems, we will explore how Linear Regression for classification works. As with the Perceptron Learning Algorithm in Homework #1, you will create your own target function f and data set D. Take d= 2 so you can visualize the problem, and assume x = (-1, 1] x [-1,1] with uniform probability of picking each xe x. In each run, choose a random line in the plane as your target function f (do this by taking two random, uniformly distributed points in [-1,1] x [-1,1] and taking the line passing through them), where one side of the line maps to +1 and the other maps to -1. Choose the inputs Xn of the data set as random points (uniformly in x), and evaluate the target function on each xn to get the corresponding output yn. 5. Take N = 100. Use Linear Regression to find g and evaluate Ein, the fraction of in-sample points which got classified incorrectly. Repeat the experiment 1000 times and take the average (keep the g's as they will be used again in Problem 6). Which of the following values is closest to the average Ein? (Closest is the option that makes the expression your answer-given option closest to 0. Use this definition of closest here and throughout). (a) 0 (b) 0.001 (c) 0.01 (d) 0.1 (e) 0.5 6. Now, generate 1000 fresh points and use them to estimate the out-of-sample error Eout of g that you got in Problem 5 (number of miscalssified out-of-sample points/total number of out-of sample points). Again, run the experiment 1000 times and take the average. Which value is closest to the average Eout? (a) o (b) 0.001
Step by Step Solution
There are 3 Steps involved in it

Get step-by-step solutions from verified subject matter experts