

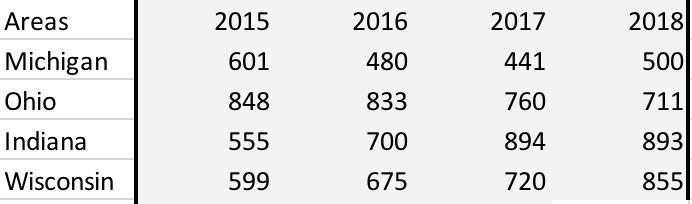
Question: Areas Michigan Ohio Indiana Wisconsin 2015 601 848 555 599 2016 480 833 700 675 2017 441 760 894 720 2018 500 711 893
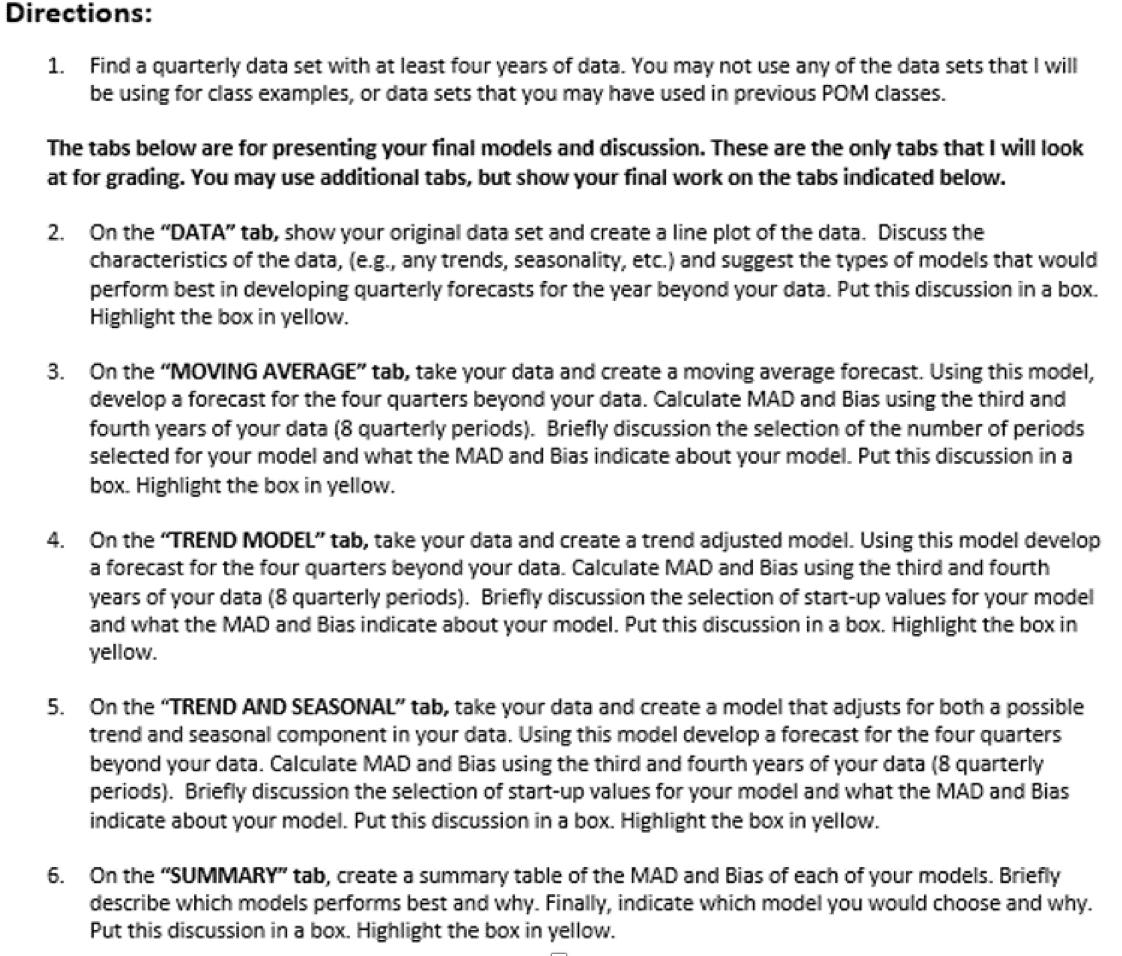
Areas Michigan Ohio Indiana Wisconsin 2015 601 848 555 599 2016 480 833 700 675 2017 441 760 894 720 2018 500 711 893 855 Directions: 1. Find a quarterly data set with at least four years of data. You may not use any of the data sets that I will be using for class examples, or data sets that you may have used in previous POM classes. The tabs below are for presenting your final models and discussion. These are the only tabs that I will look at for grading. You may use additional tabs, but show your final work on the tabs indicated below. 2. On the "DATA" tab, show your original data set and create a line plot of the data. Discuss the characteristics of the data, (e.g., any trends, seasonality, etc.) and suggest the types of models that would perform best in developing quarterly forecasts for the year beyond your data. Put this discussion in a box. Highlight the box in yellow. 3. On the "MOVING AVERAGE" tab, take your data and create a moving average forecast. Using this model, develop a forecast for the four quarters beyond your data. Calculate MAD and Bias using the third and fourth years of your data (8 quarterly periods). Briefly discussion the selection of the number of periods selected for your model and what the MAD and Bias indicate about your model. Put this discussion in a box. Highlight the box in yellow. 4. On the "TREND MODEL" tab, take your data and create a trend adjusted model. Using this model develop a forecast for the four quarters beyond your data. Calculate MAD and Bias using the third and fourth years of your data (8 quarterly periods). Briefly discussion the selection of start-up values for your model and what the MAD and Bias indicate about your model. Put this discussion in a box. Highlight the box in yellow. 5. On the "TREND AND SEASONAL" tab, take your data and create a model that adjusts for both a possible trend and seasonal component in your data. Using this model develop a forecast for the four quarters beyond your data. Calculate MAD and Bias using the third and fourth years of your data (8 quarterly periods). Briefly discussion the selection of start-up values for your model and what the MAD and Bias indicate about your model. Put this discussion in a box. Highlight the box in yellow. 6. On the "SUMMARY" tab, create a summary table of the MAD and Bias of each of your models. Briefly describe which models performs best and why. Finally, indicate which model you would choose and why. Put this discussion in a box. Highlight the box in yellow.
Step by Step Solution
3.41 Rating (157 Votes )
There are 3 Steps involved in it
1 Michigan experienced the greatest year over year growth in the first quarter of 2018 with an inc... View full answer

Get step-by-step solutions from verified subject matter experts