

Question: Answer questions below Task 1 Critical Thinking and Literacy (14 points) 1. Consider the following measures: mean, median, variance, standard deviation, and percentile. a) Which
Answer questions below
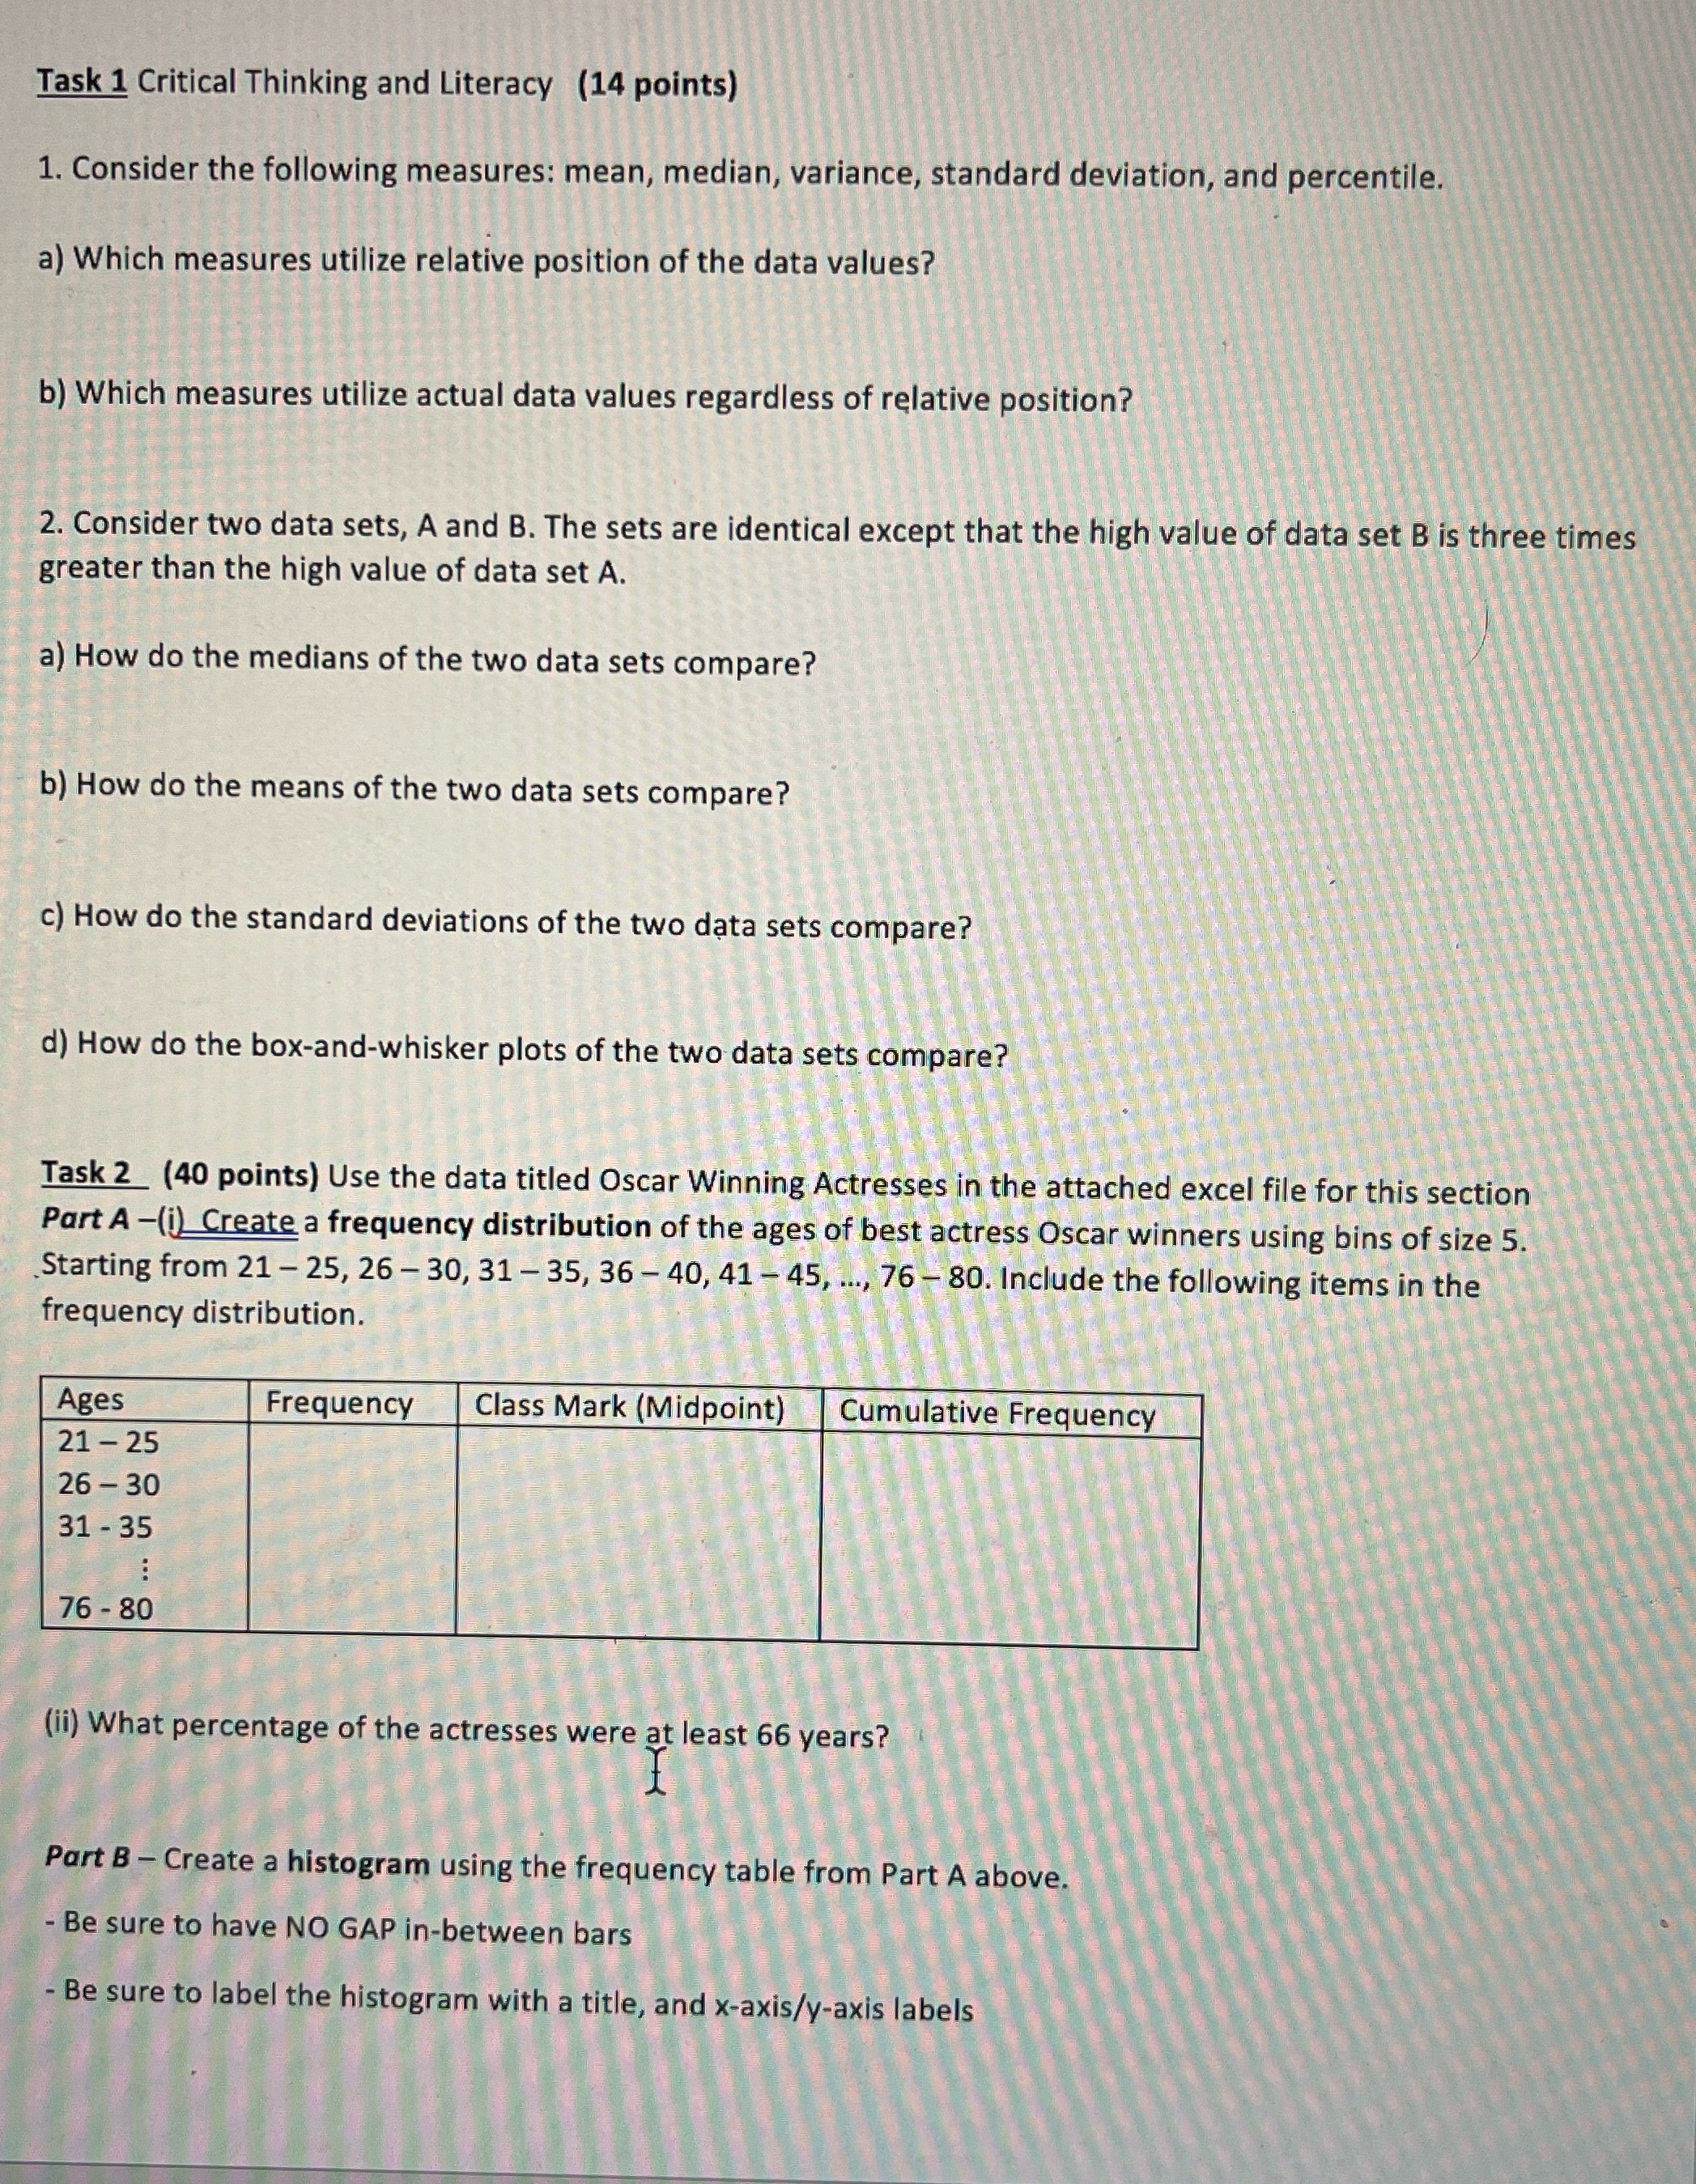
Task 1 Critical Thinking and Literacy (14 points) 1. Consider the following measures: mean, median, variance, standard deviation, and percentile. a) Which measures utilize relative position of the data values? b) Which measures utilize actual data values regardless of relative position? 2. Consider two data sets, A and B. The sets are identical except that the high value of data set B is three times greater than the high value of data set A. a) How do the medians of the two data sets compare? b) How do the means of the two data sets compare? c) How do the standard deviations of the two data sets compare? d) How do the box-and-whisker plots of the two data sets compare? Task 2 (40 points) Use the data titled Oscar Winning Actresses in the attached excel file for this section Part A -()_Create a frequency distribution of the ages of best actress Oscar winners using bins of size 5 Starting from 21 - 25, 26 - 30, 31 - 35, 36 - 40, 41 - 45, ..., 76 -80. Include the following items in the frequency distribution. Ages Frequency Class Mark (Midpoint) Cumulative Frequency 21 - 25 26 - 30 31 - 35 76 - 80 ii) What percentage of the actresses were at least 66 years? Part B - Create a histogram using the frequency table from Part A above. Be sure to have NO GAP in-between bars Be sure to label the histogram with a title, and x-axis/y-axis labels
Step by Step Solution
There are 3 Steps involved in it

Get step-by-step solutions from verified subject matter experts