

Question: Answer questions below (Use Excel, TI-calculator, or any software to draw the chart. Do not draw by hand) Part C- Summarize the main features of
Answer questions below

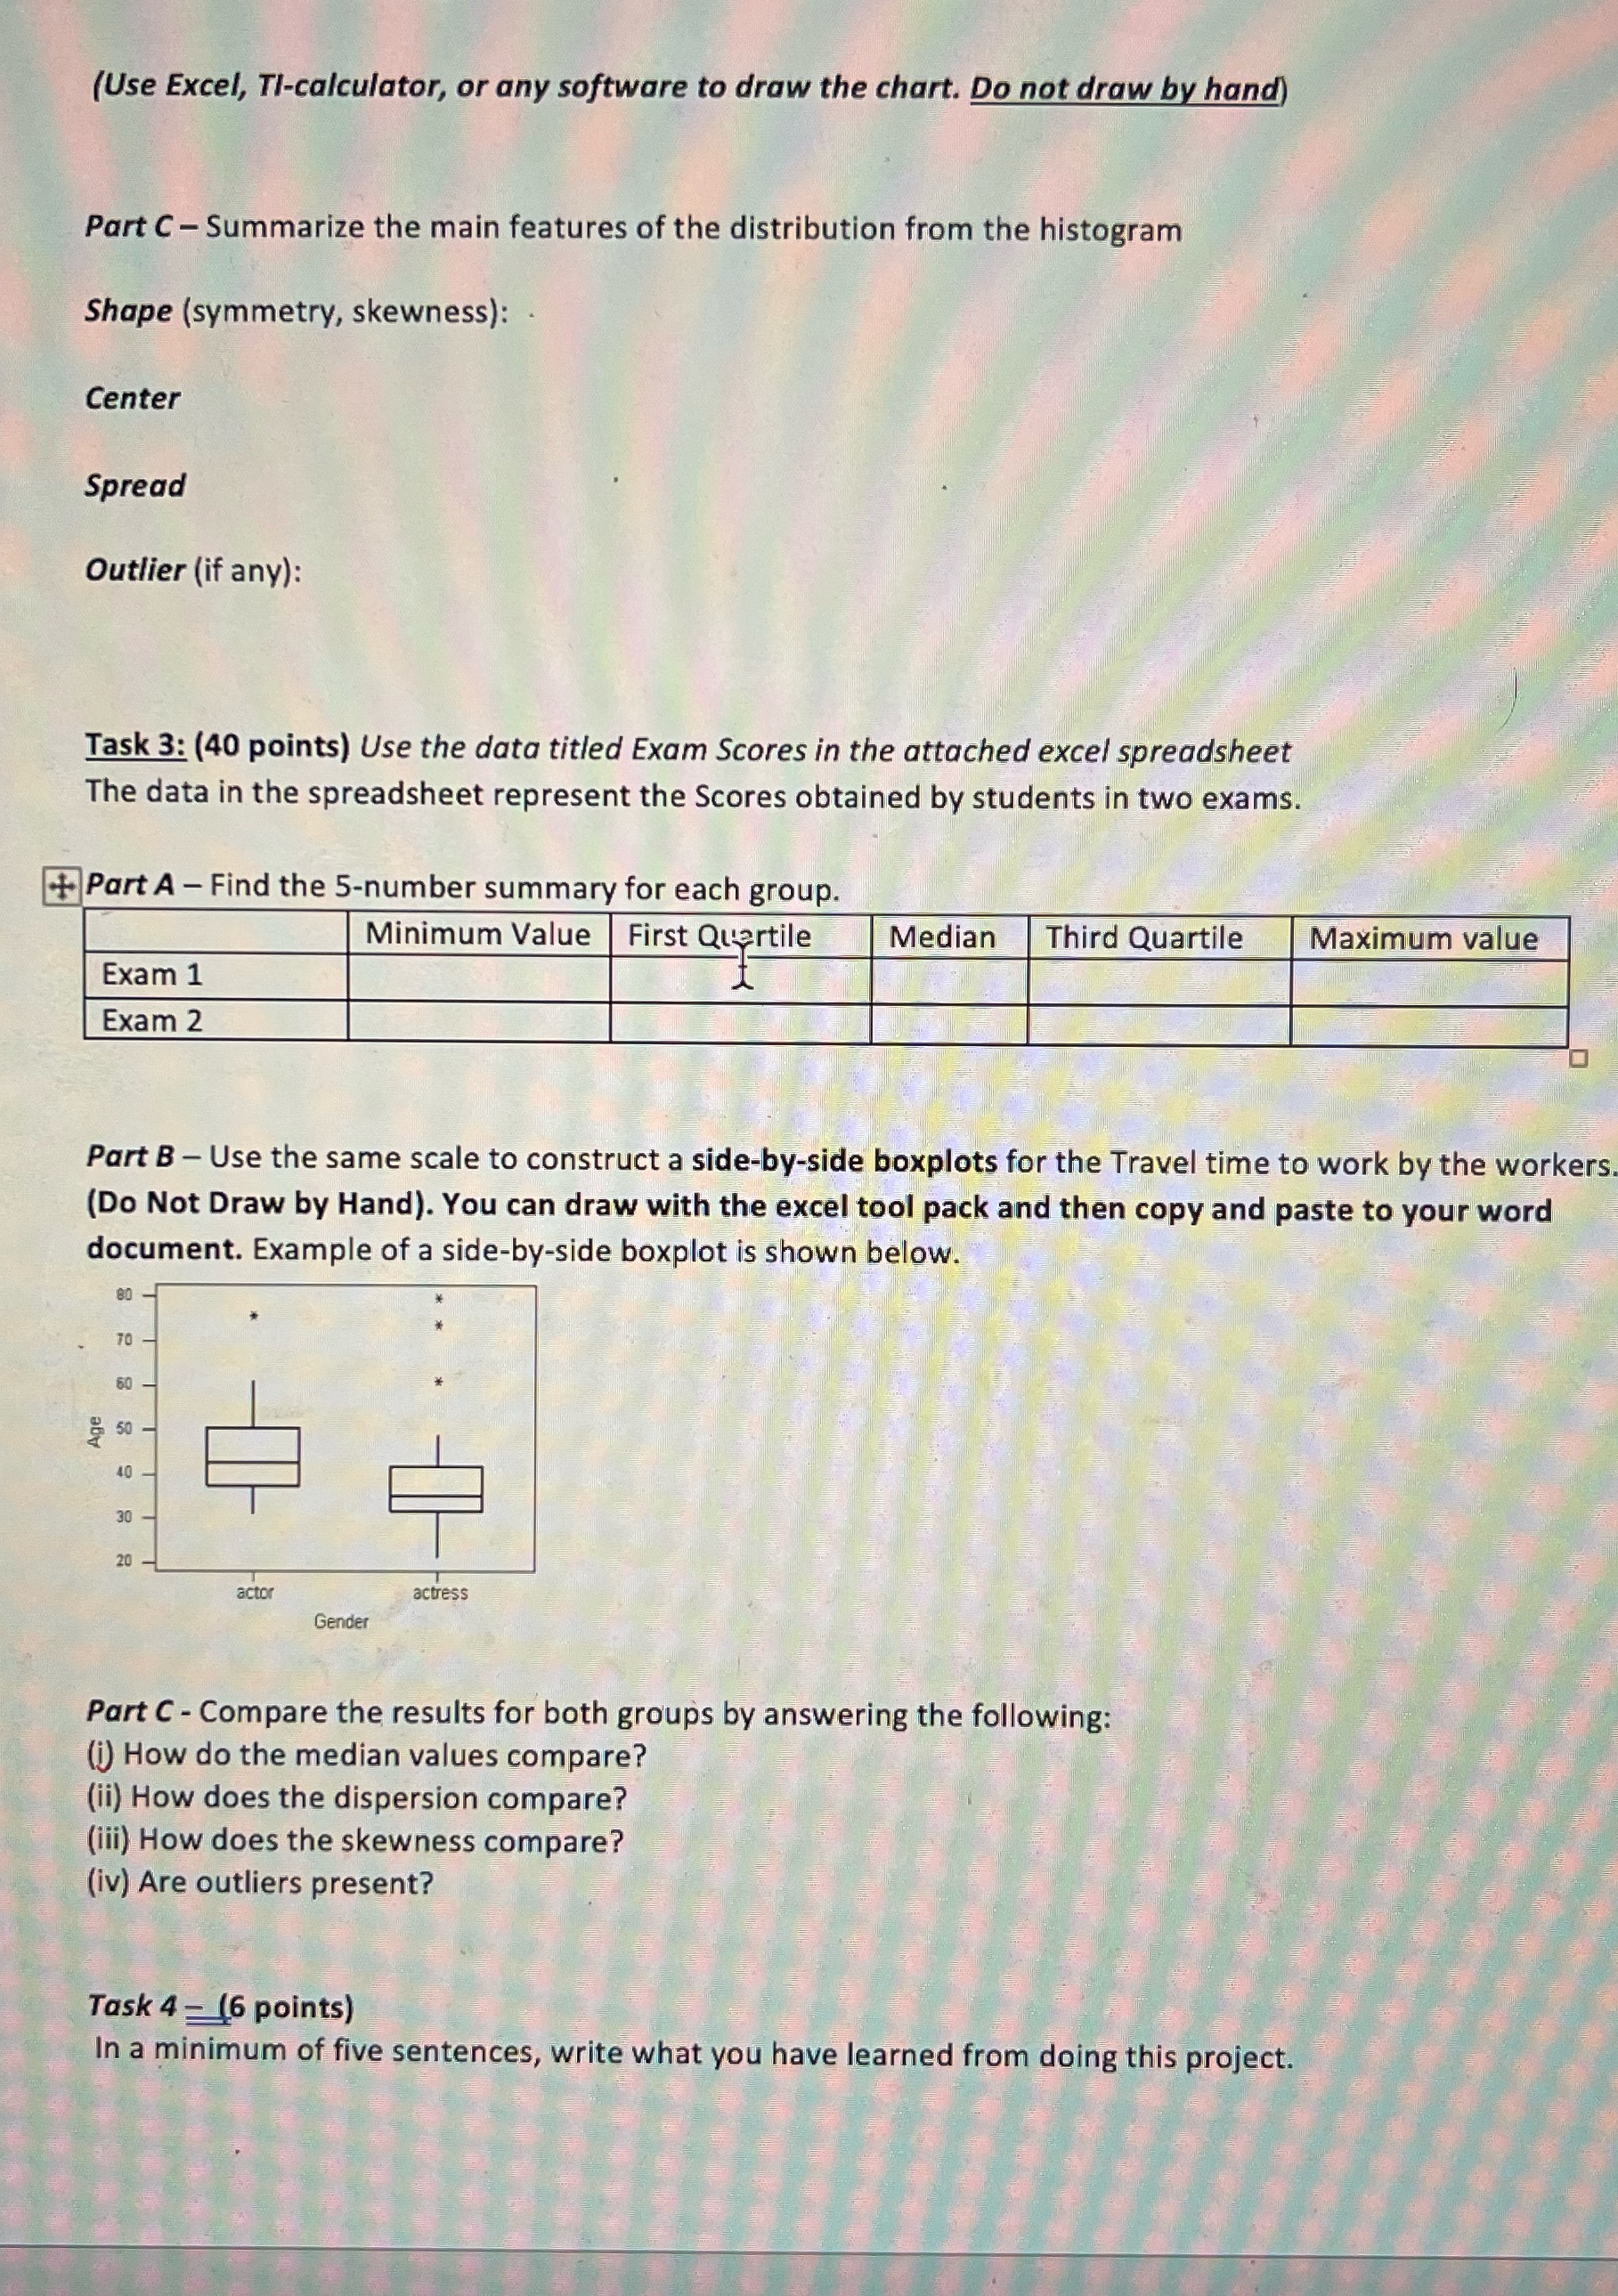
(Use Excel, TI-calculator, or any software to draw the chart. Do not draw by hand) Part C- Summarize the main features of the distribution from the histogram Shape (symmetry, skewness): Center Spread Outlier (if any): Task 3: (40 points) Use the data titled Exam Scores in the attached excel spreadsheet The data in the spreadsheet represent the Scores obtained by students in two exams. .+ Part A - Find the 5-number summary for each group. Minimum Value First Quartile Median Third Quartile Maximum value Exam 1 Exam 2 Part B - Use the same scale to construct a side-by-side boxplots for the Travel time to work by the workers (Do Not Draw by Hand). You can draw with the excel tool pack and then copy and paste to your word document. Example of a side-by-side boxplot is shown below. actor actress Gender Part C - Compare the results for both groups by answering the following: () How do the median values compare? (ii) How does the dispersion compare? (iii) How does the skewness compare? (iv) Are outliers present? Task 4 = (6 points) In a minimum of five sentences, write what you have learned from doing this project
Step by Step Solution
There are 3 Steps involved in it

Get step-by-step solutions from verified subject matter experts