

Question: answer the above for the case here - 1. Why do you think did the consultants collect both the rating (absolute terms) as well as
answer the above for the case here -
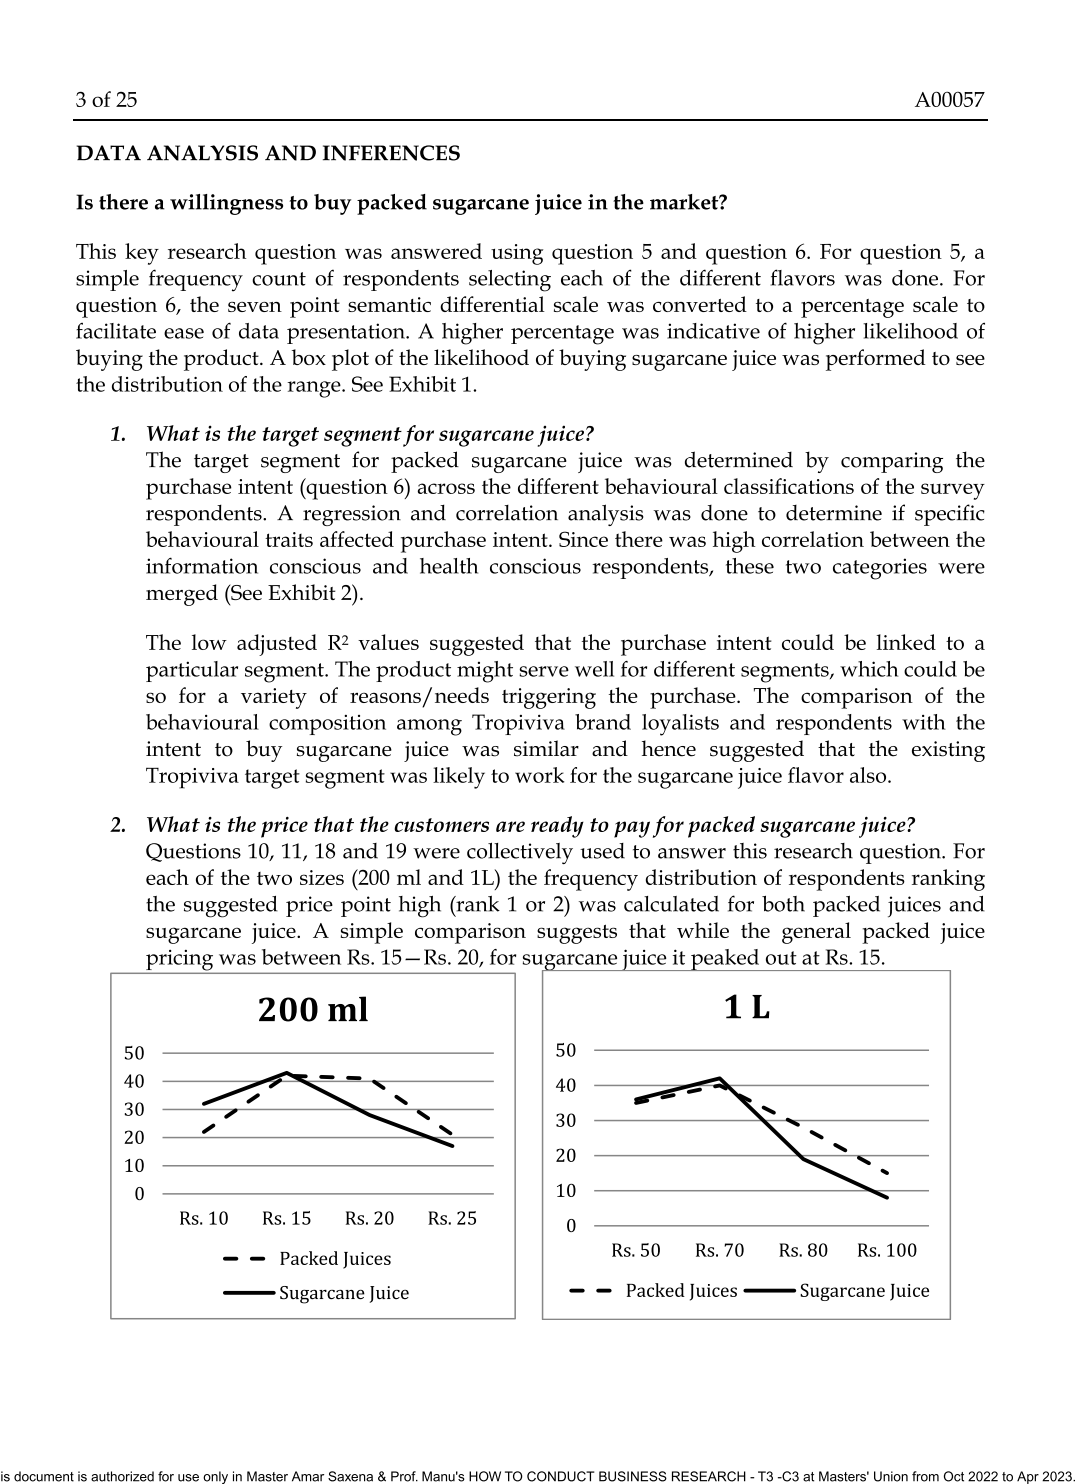
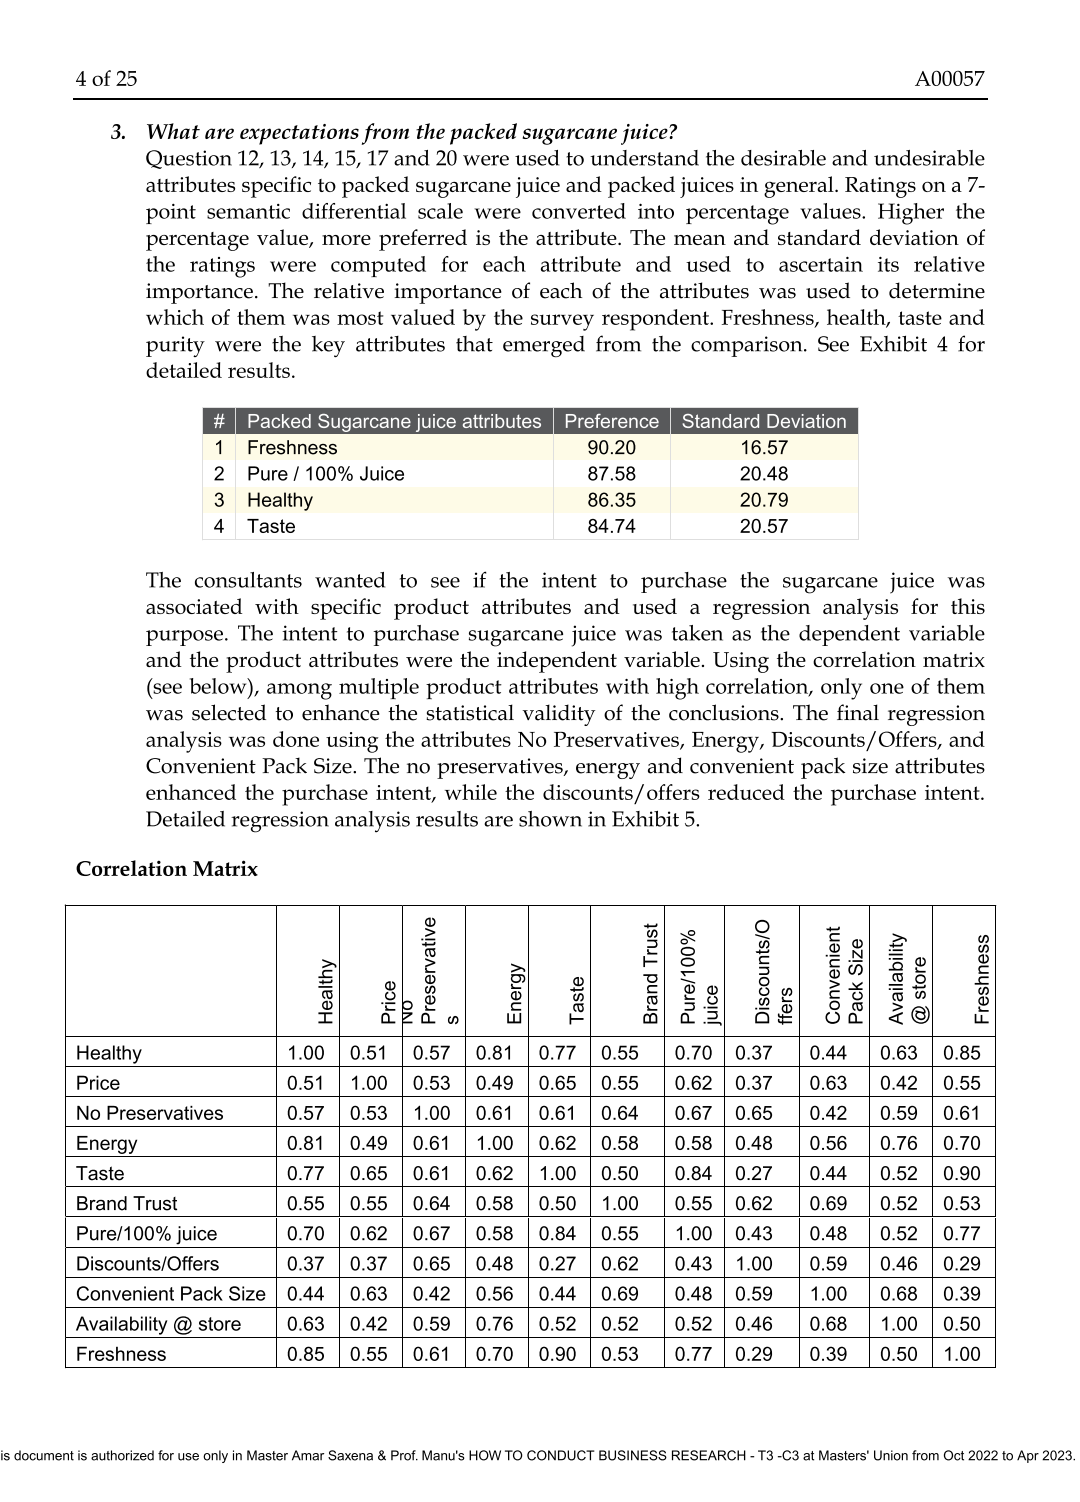
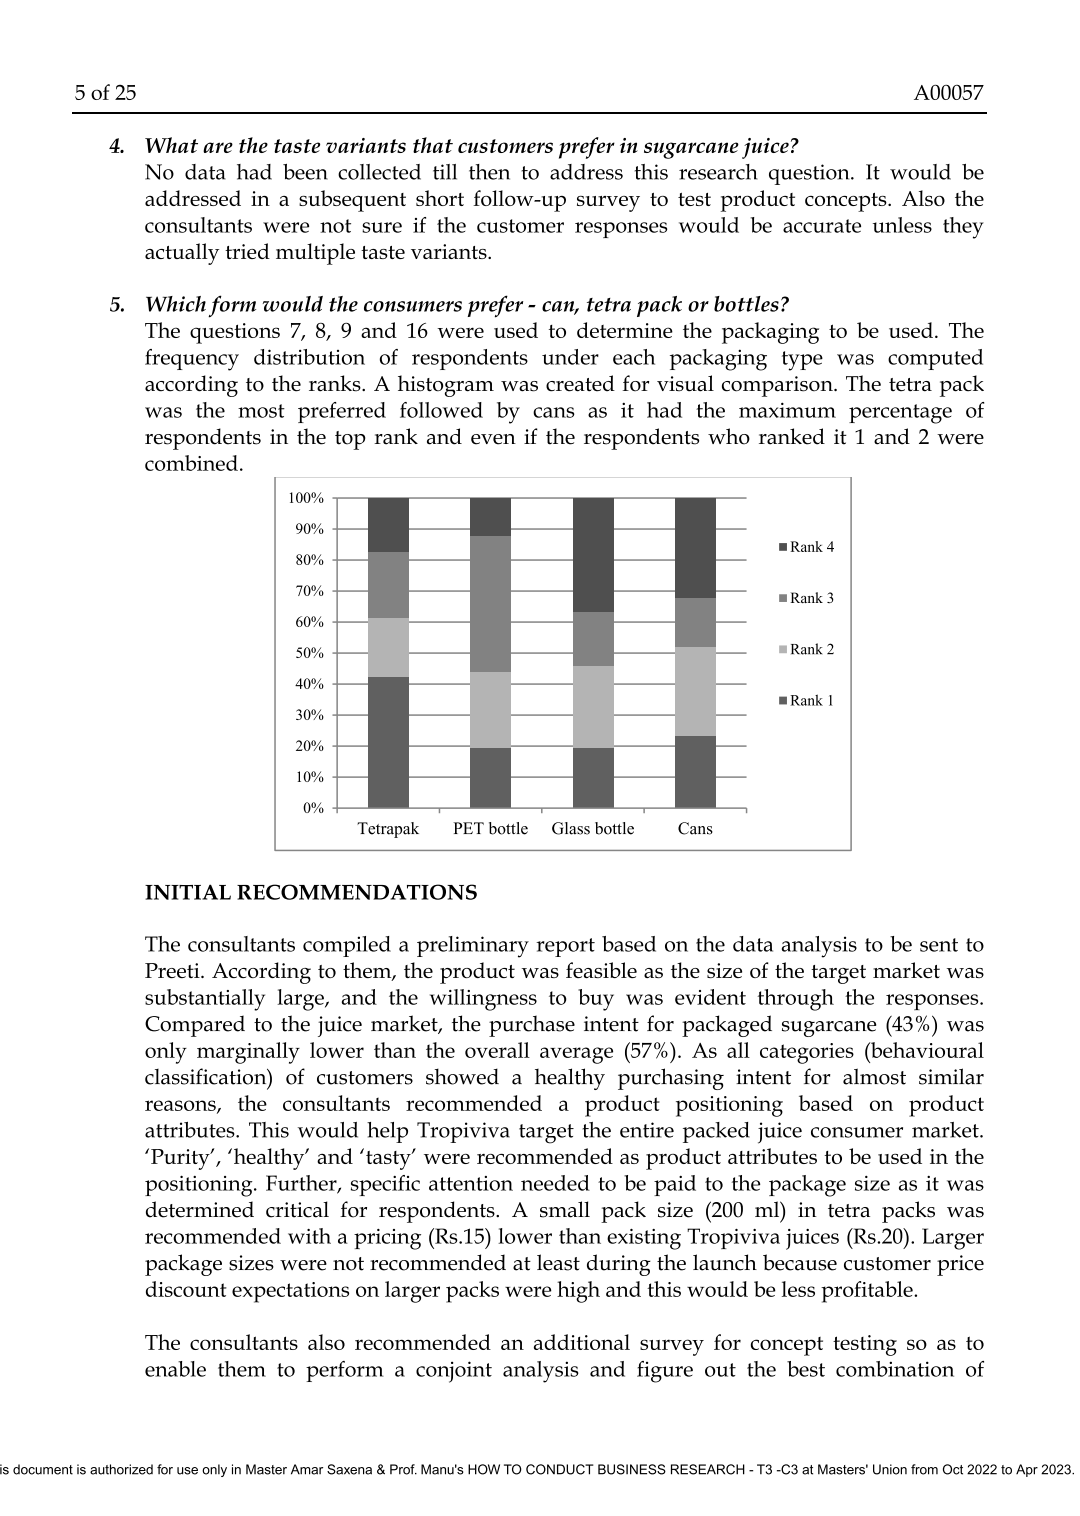
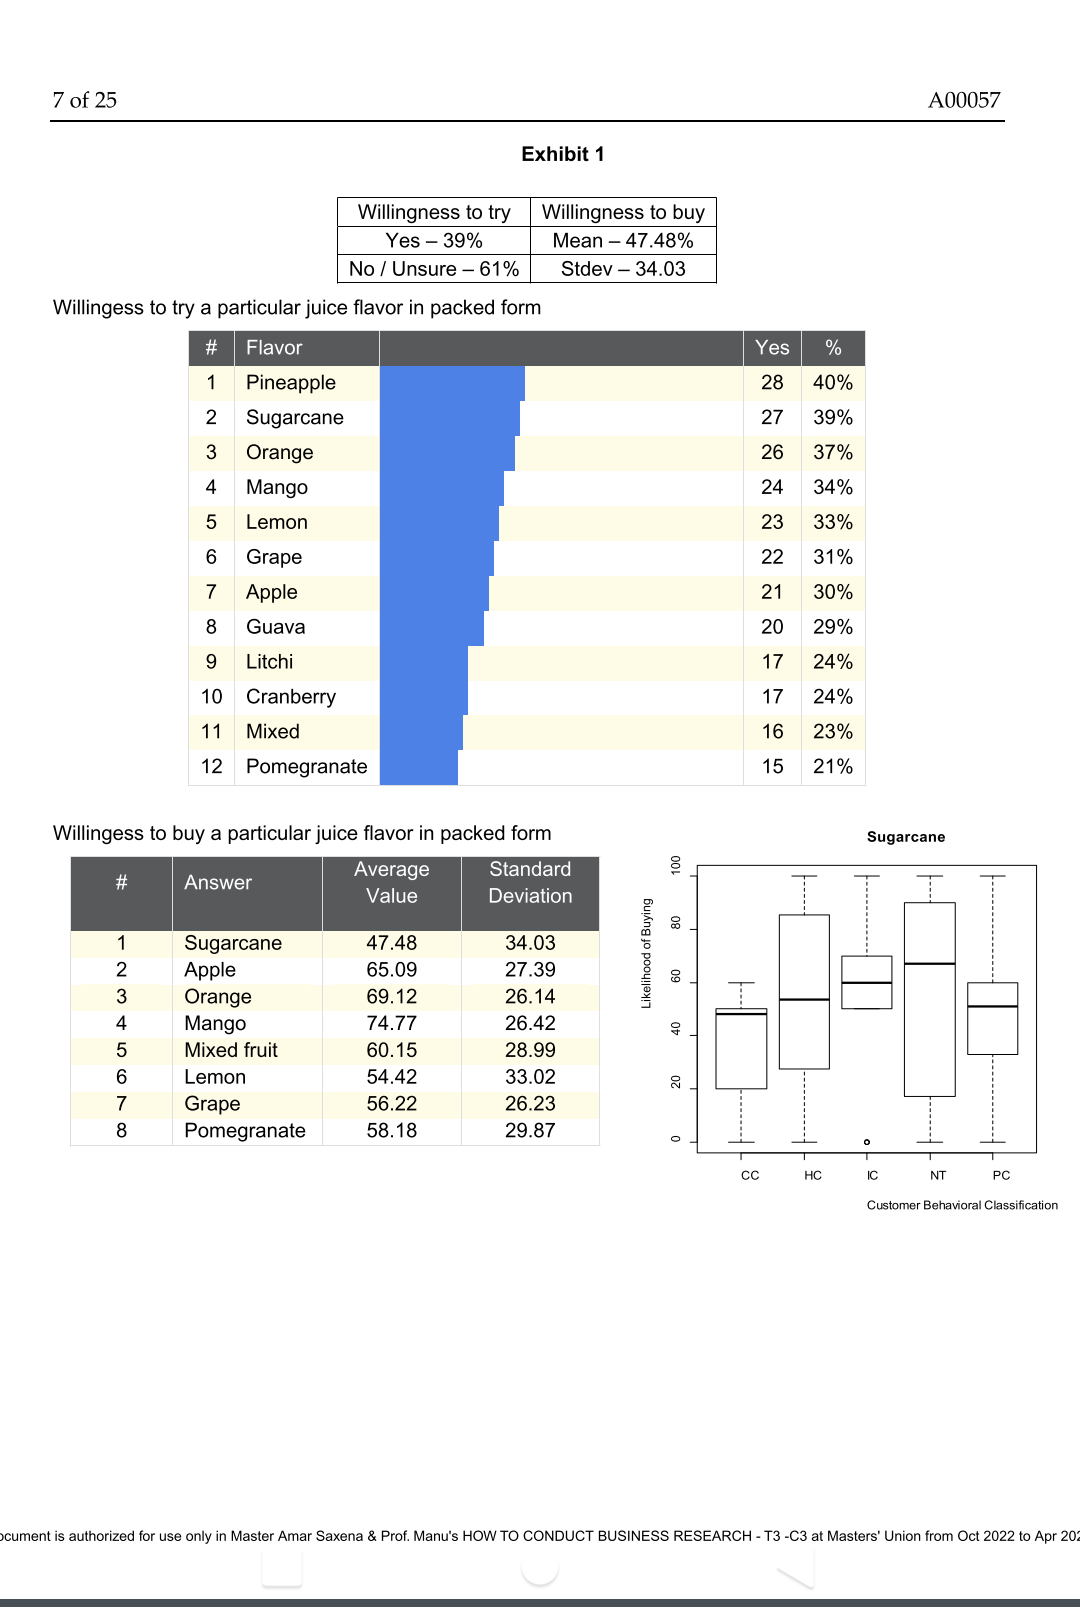
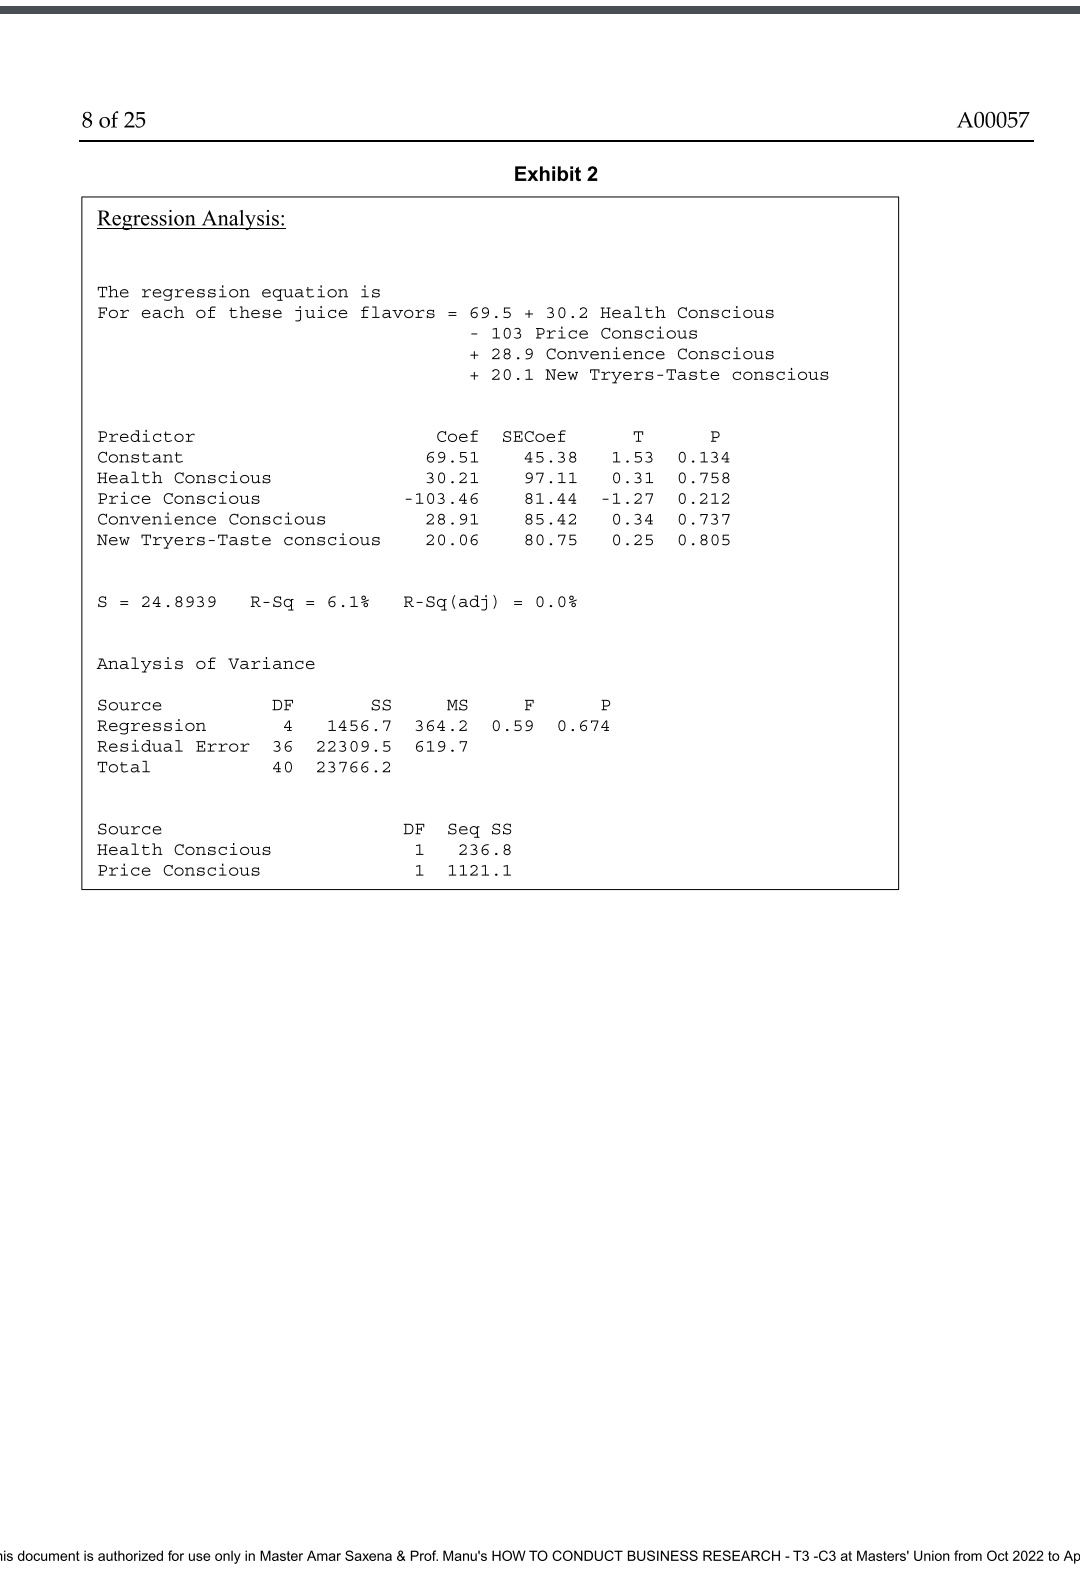
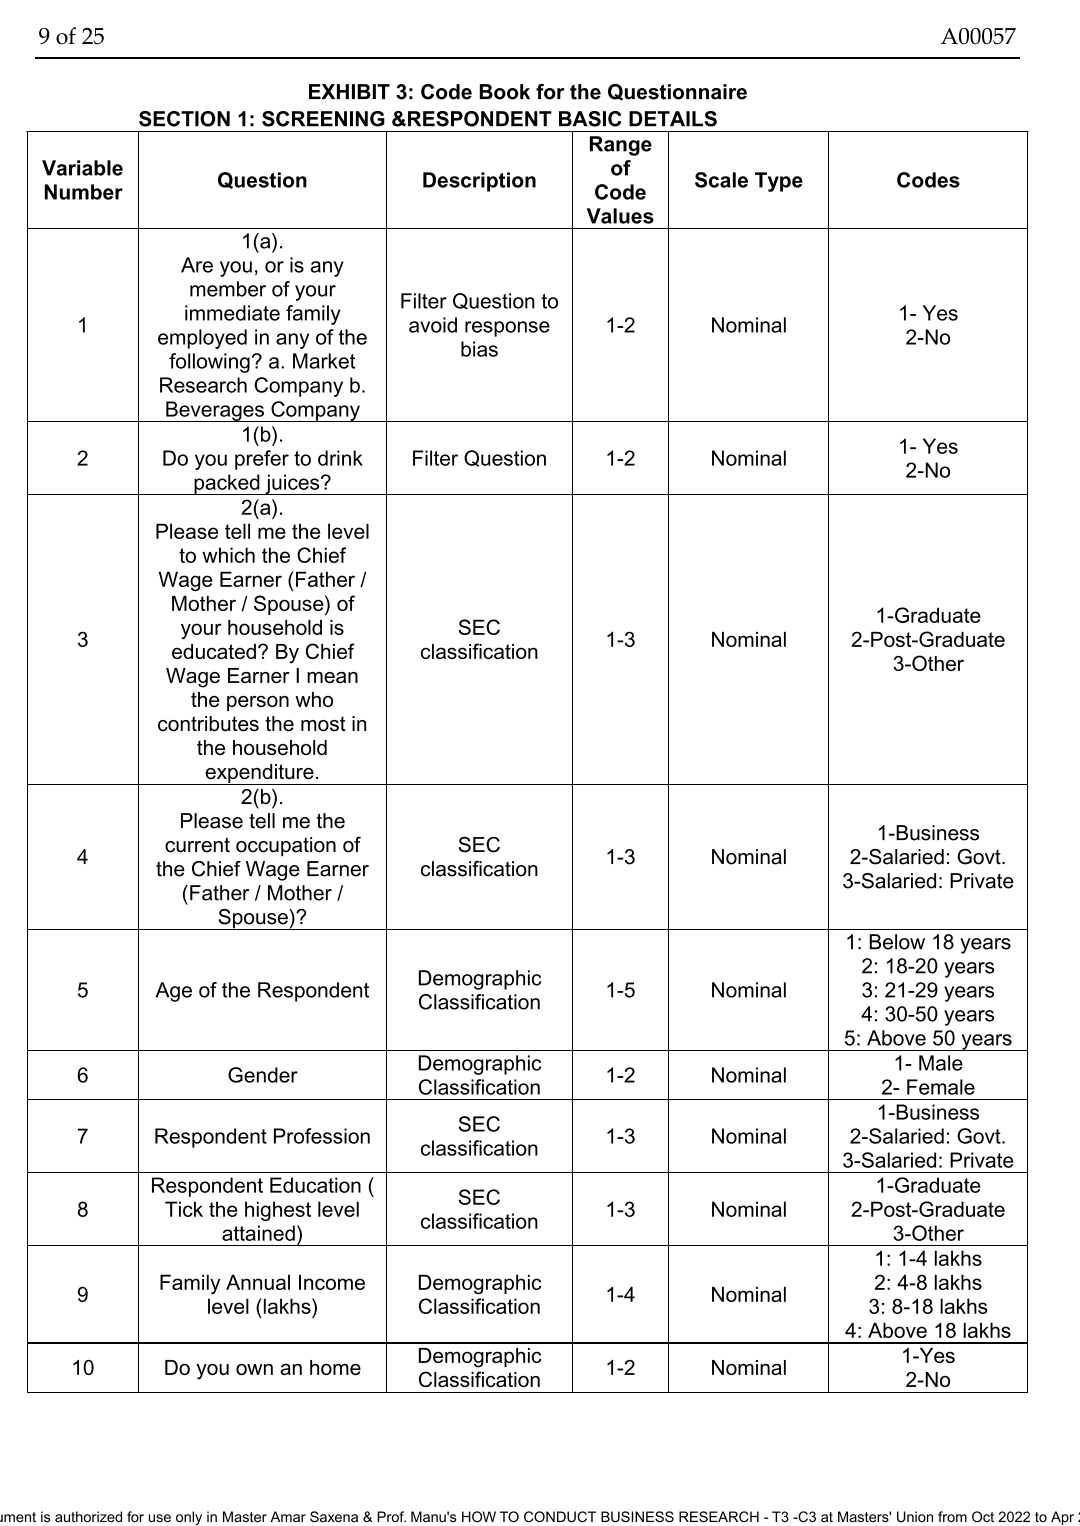
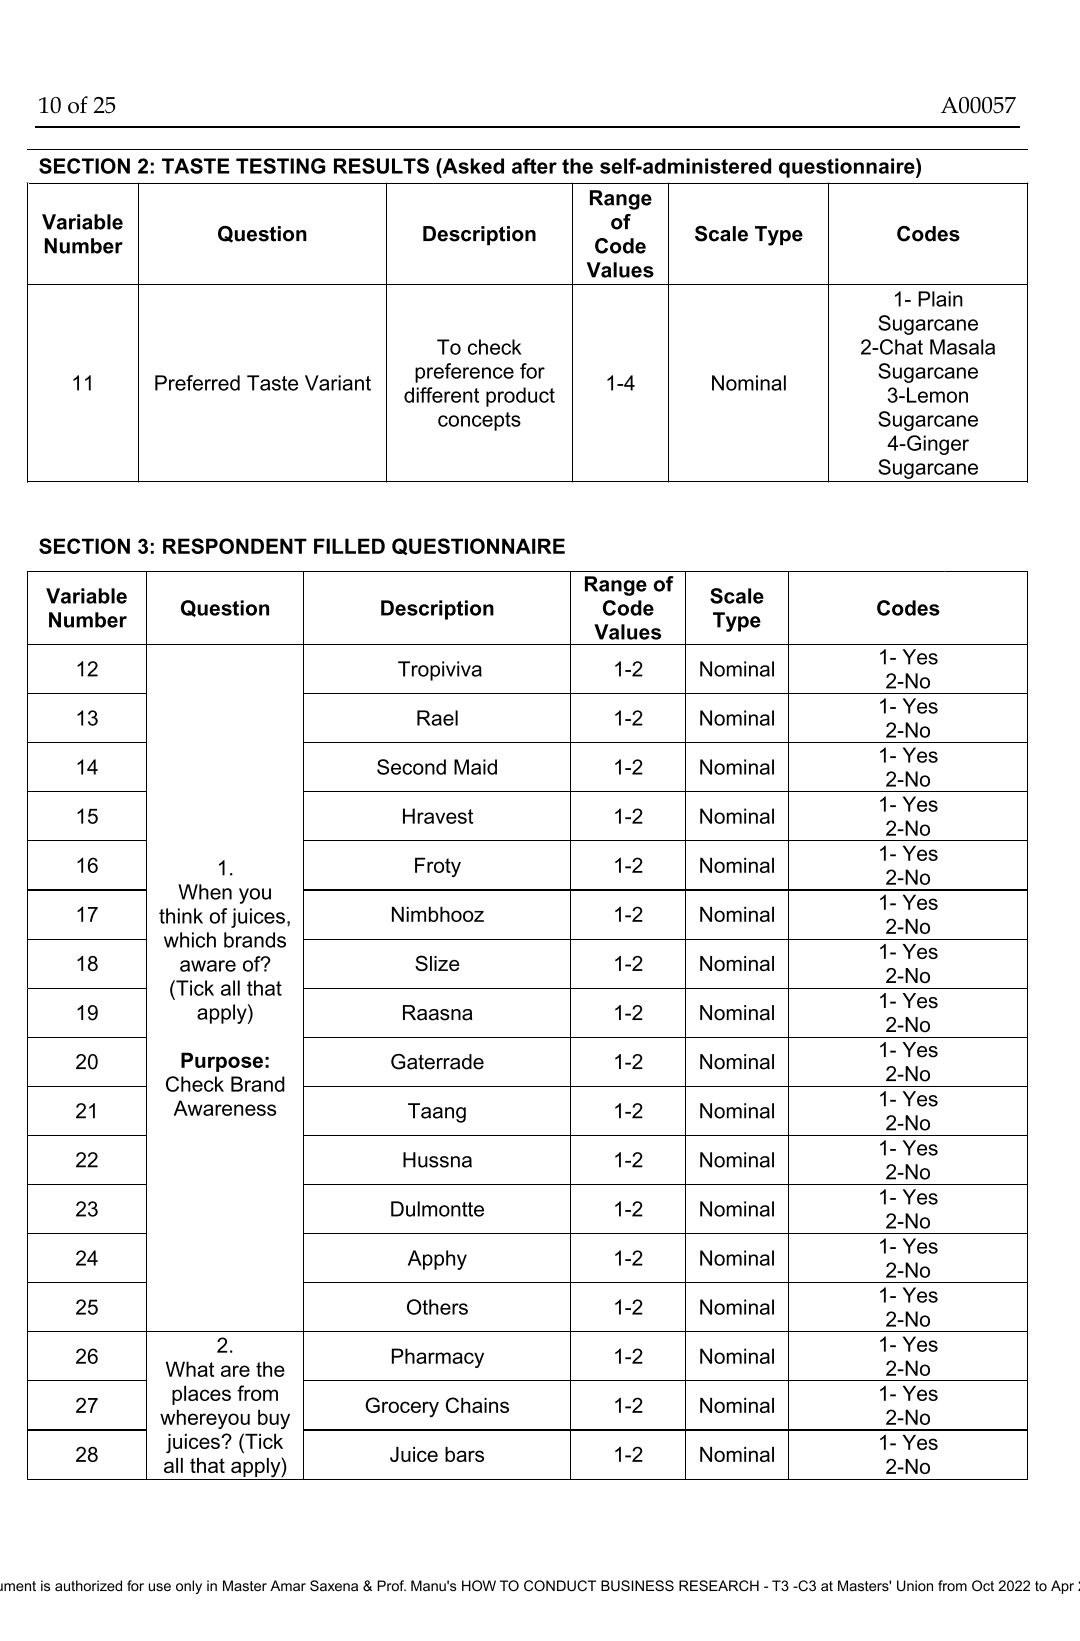
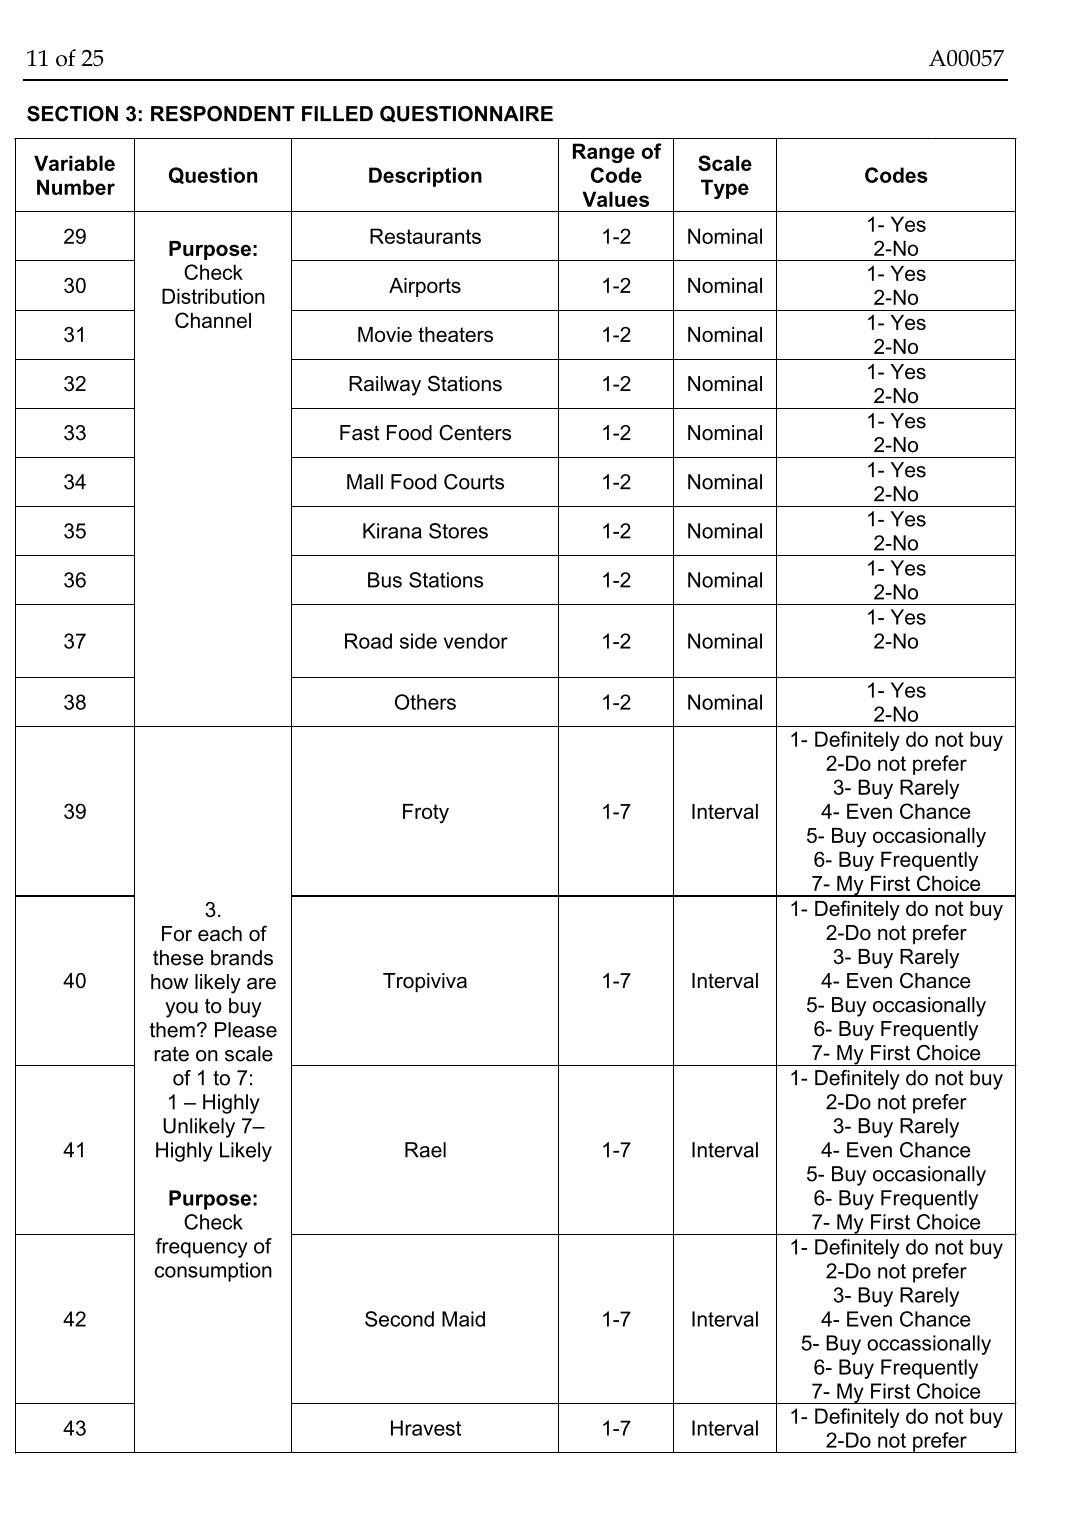
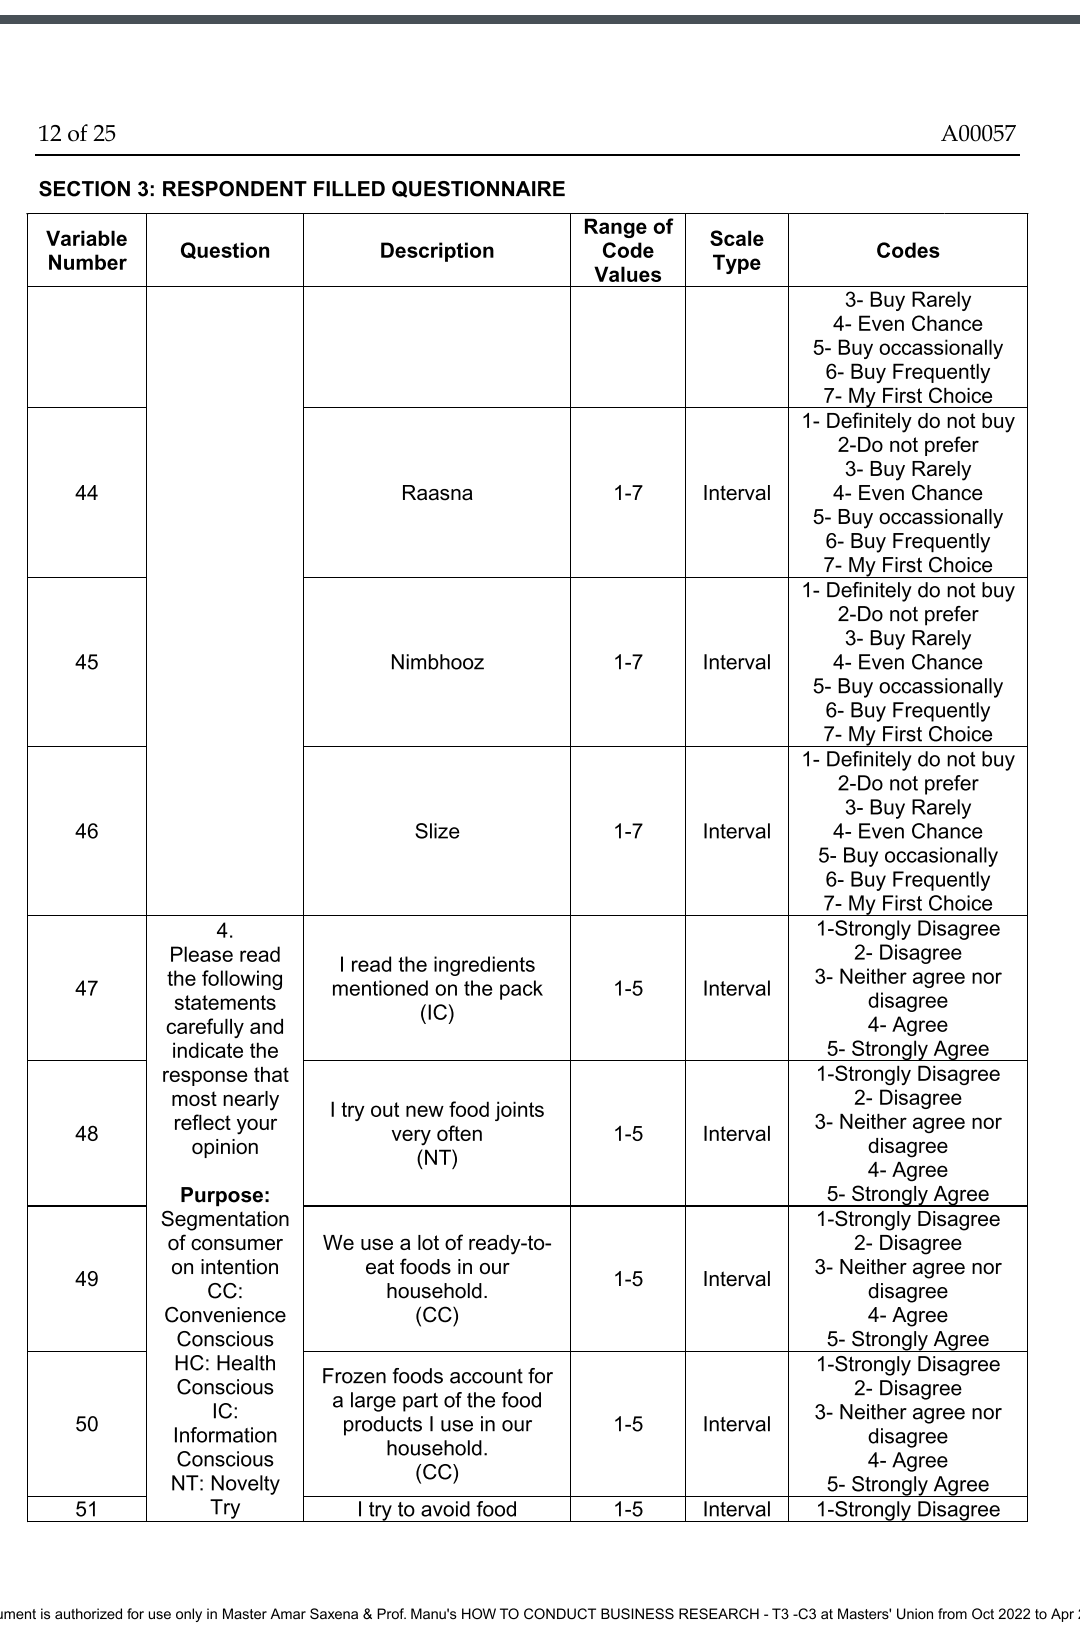
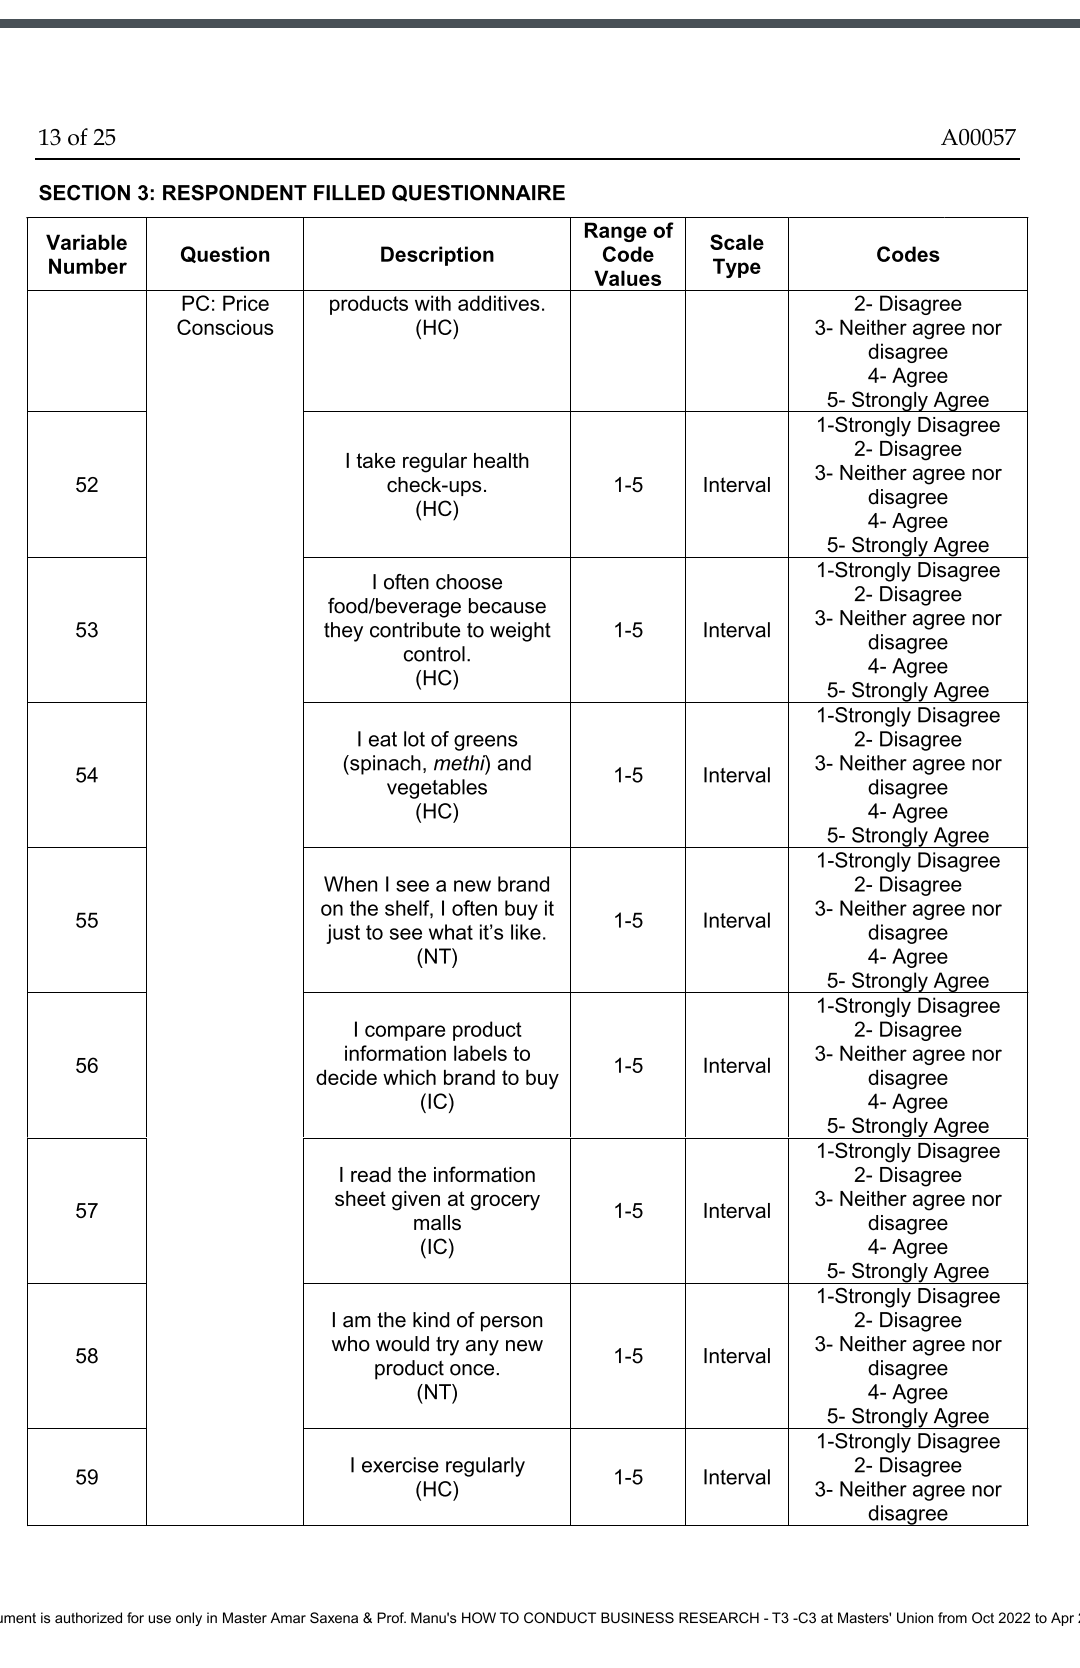
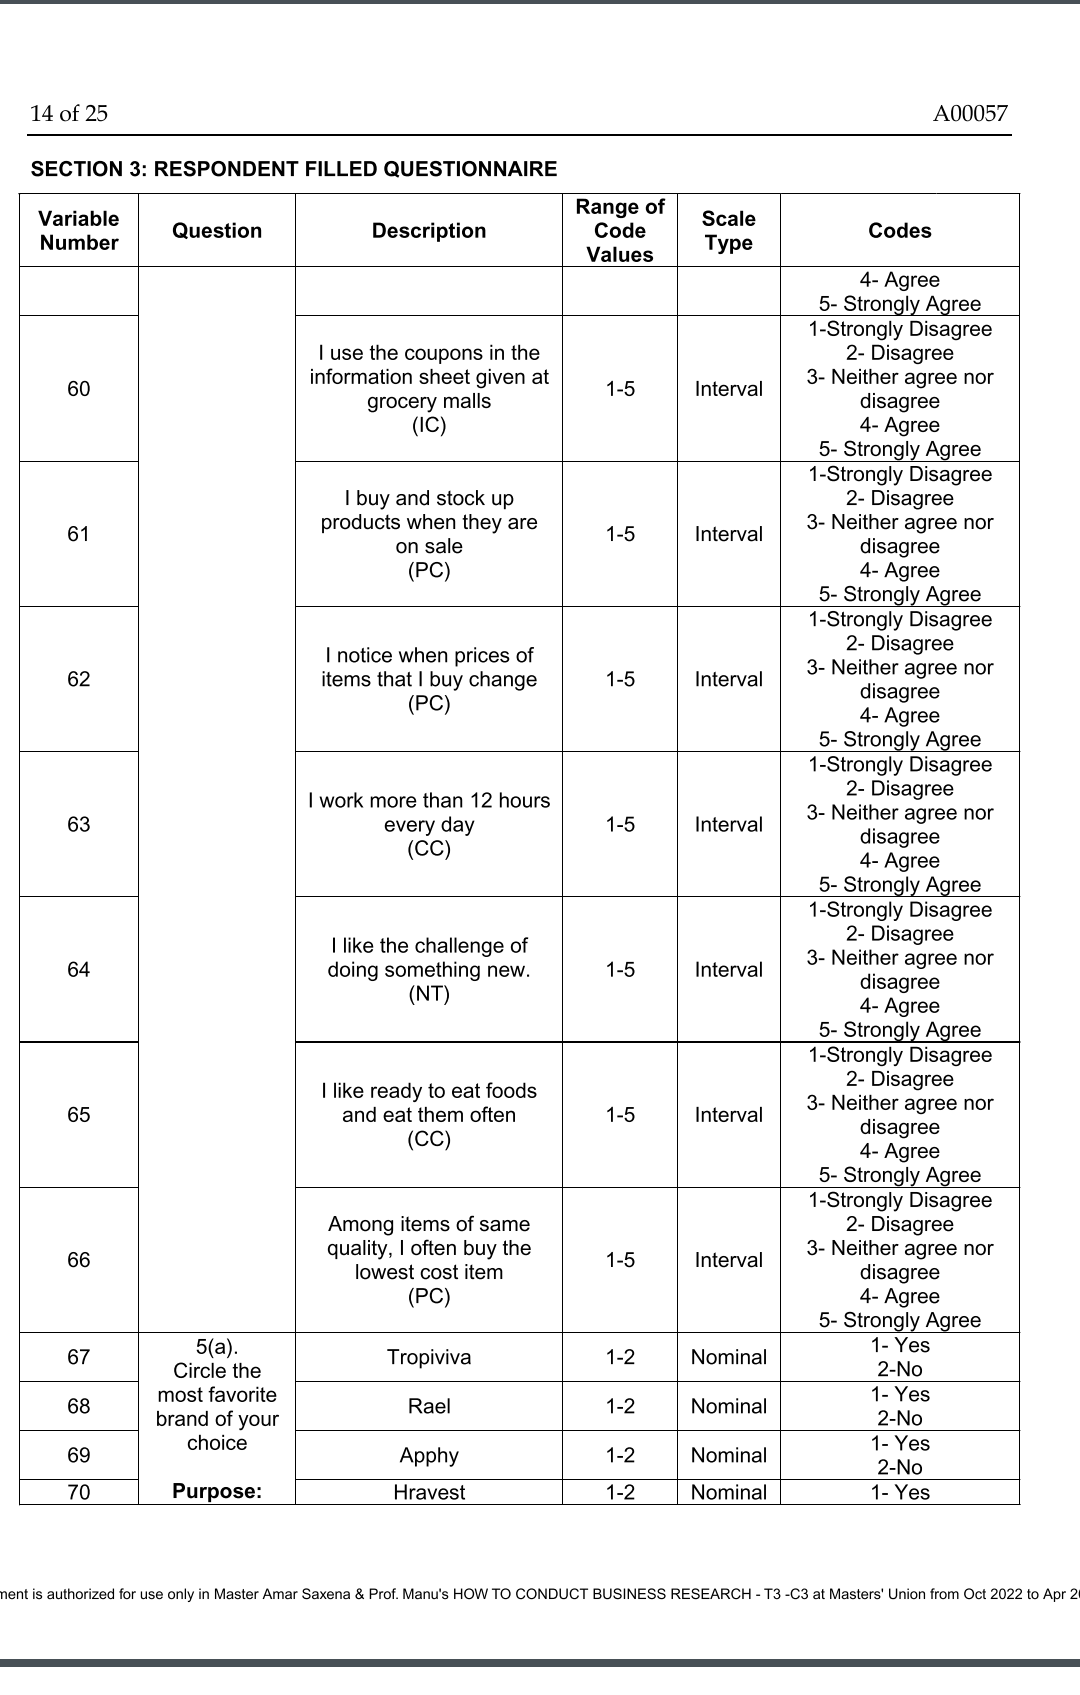
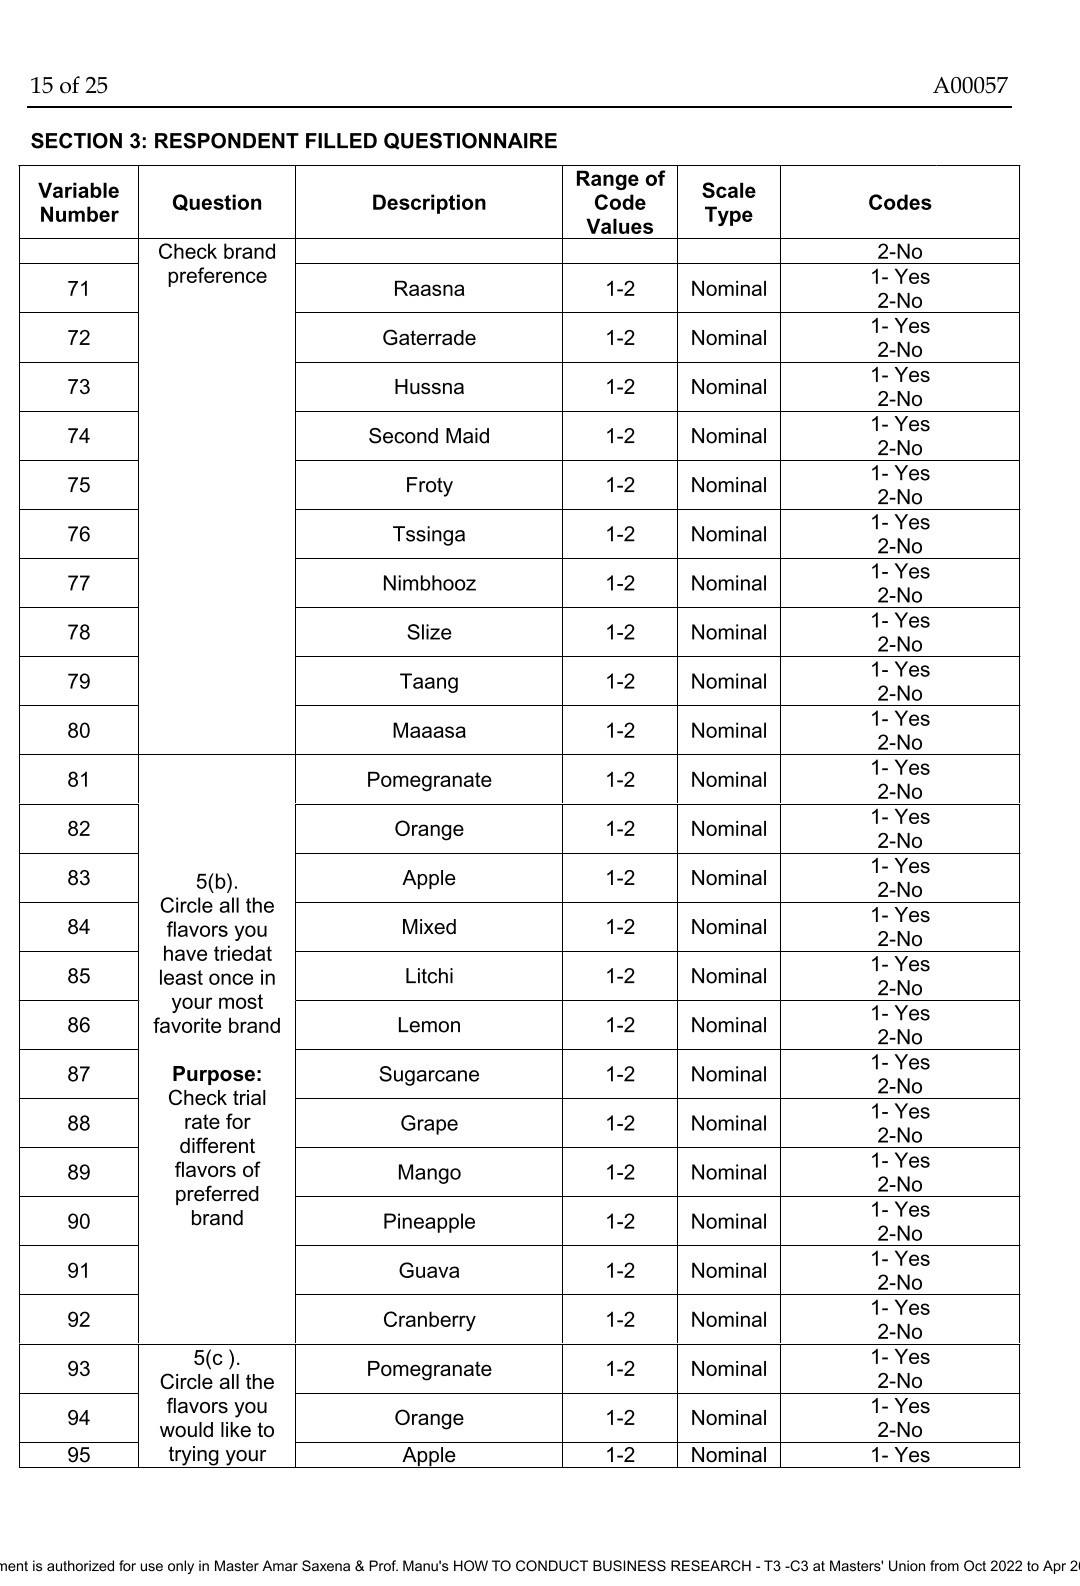
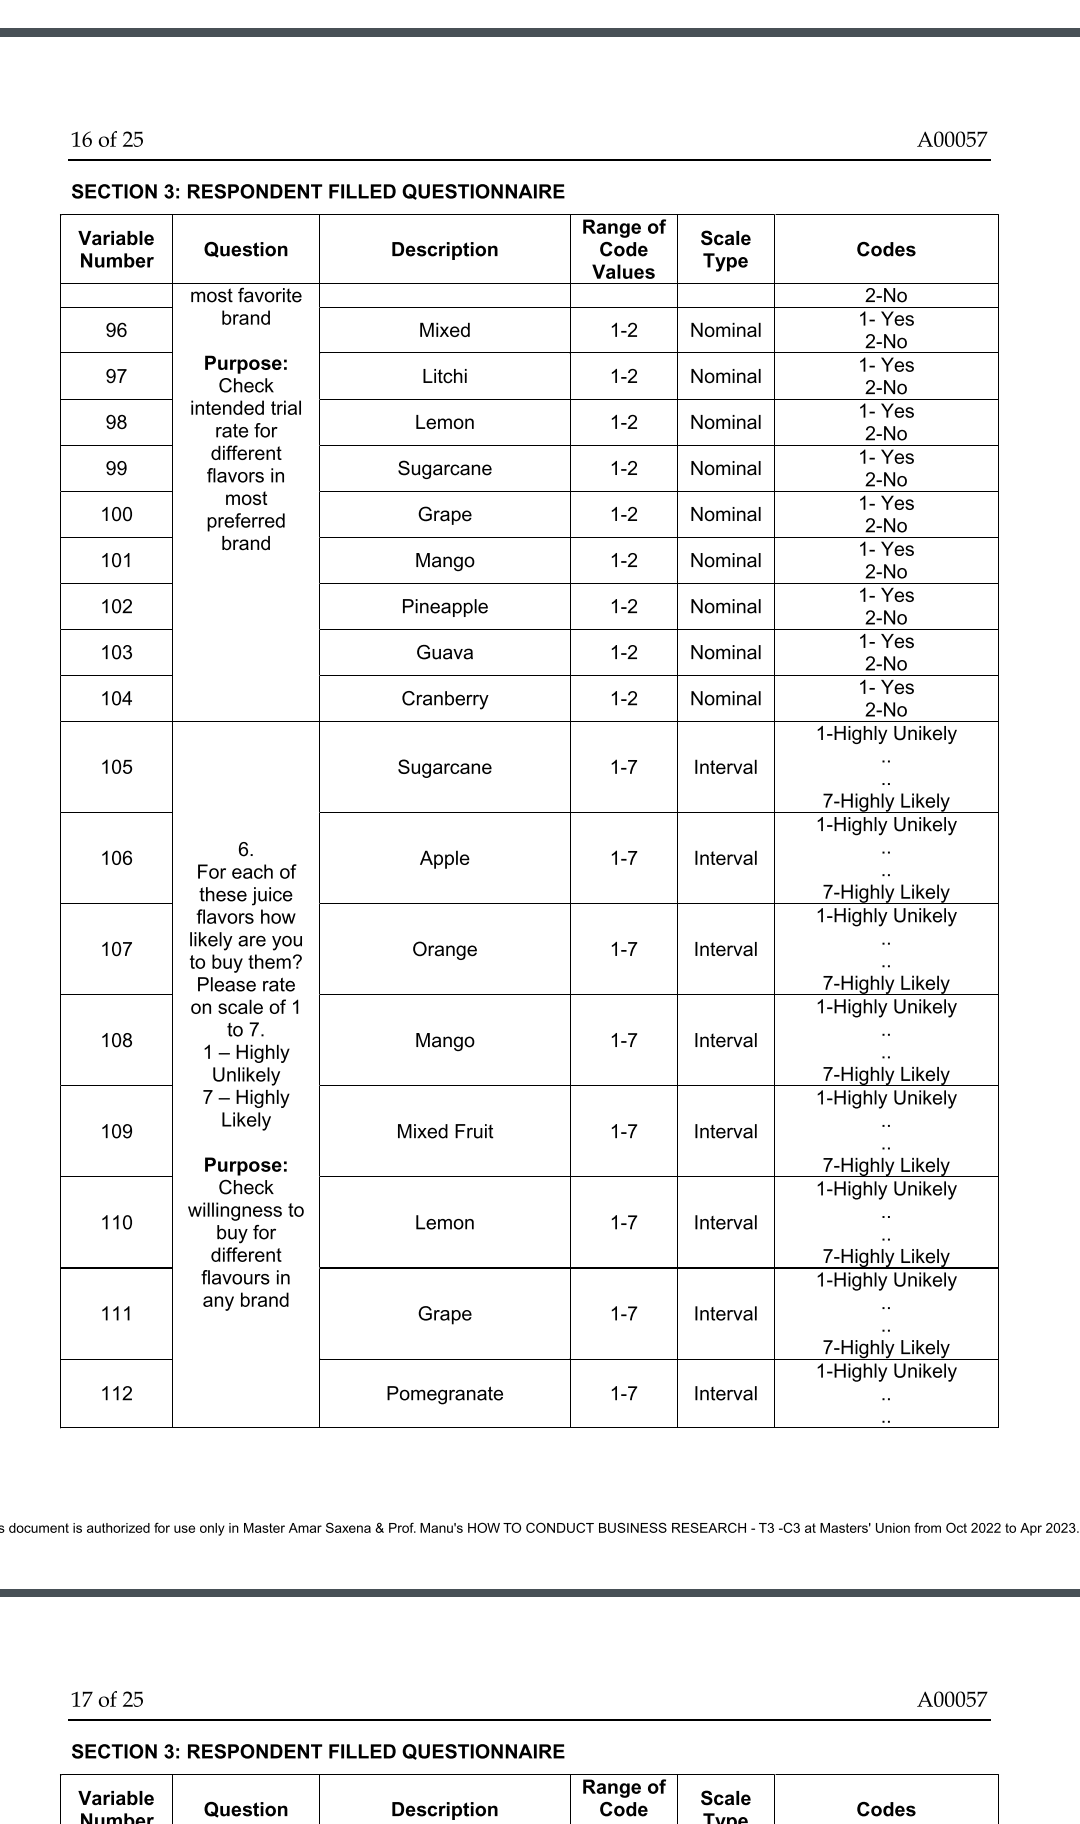
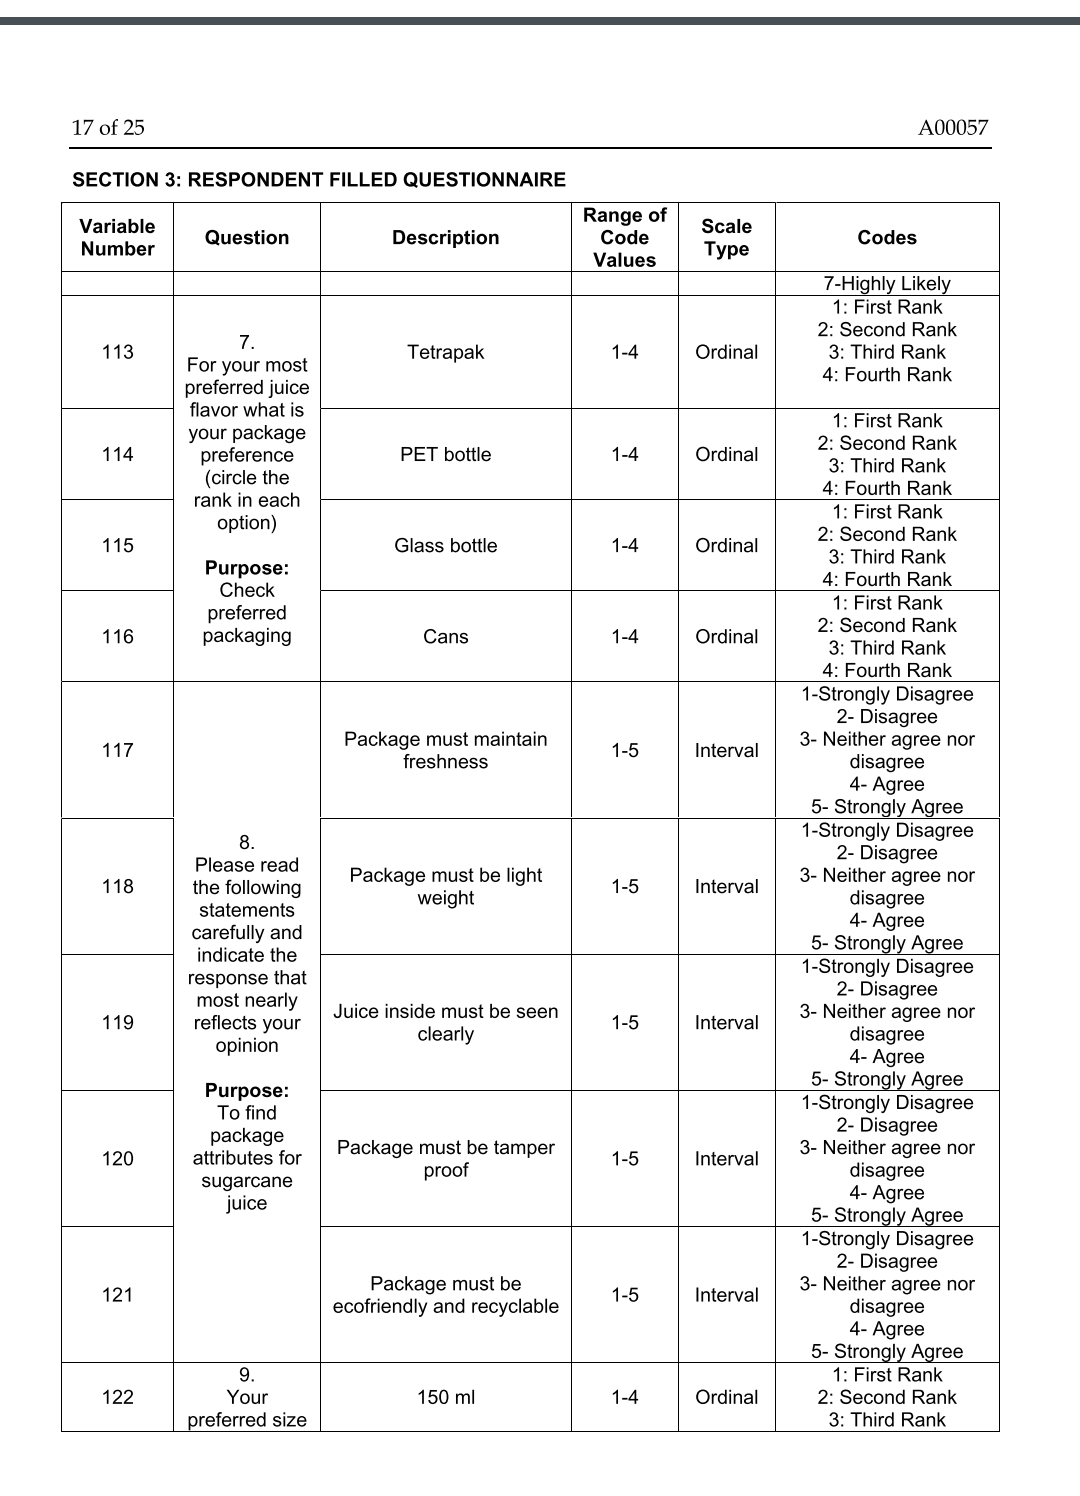
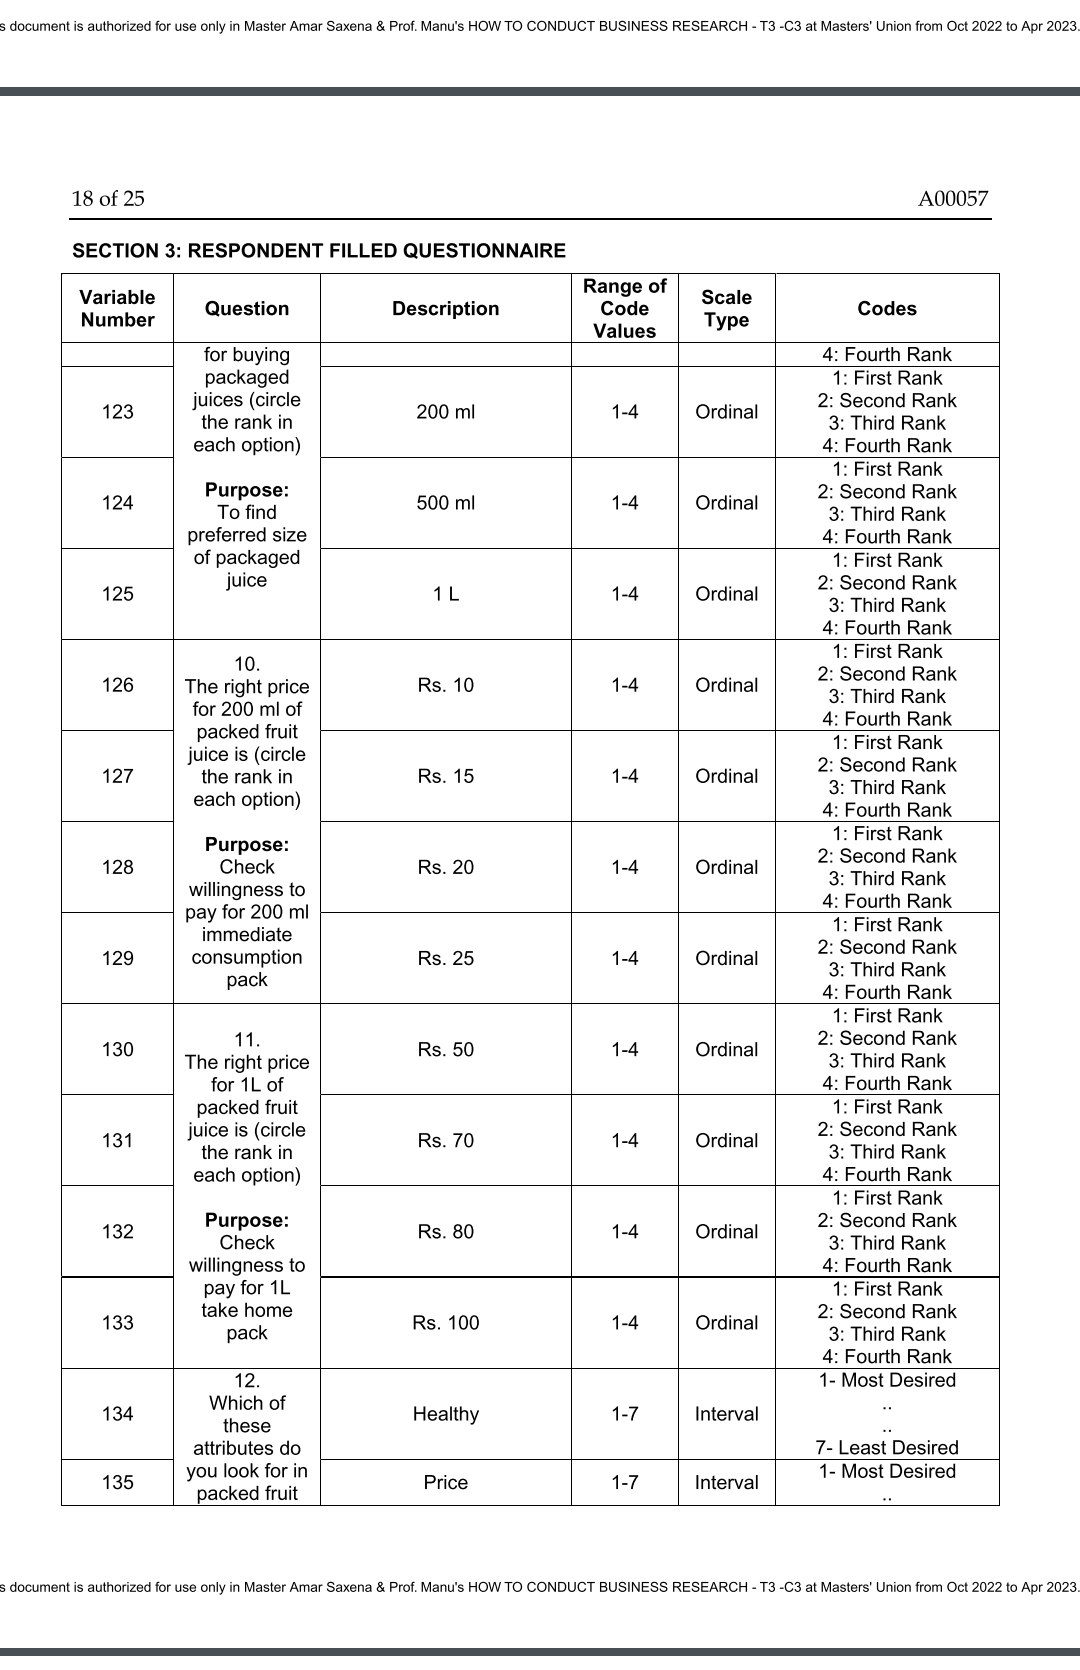
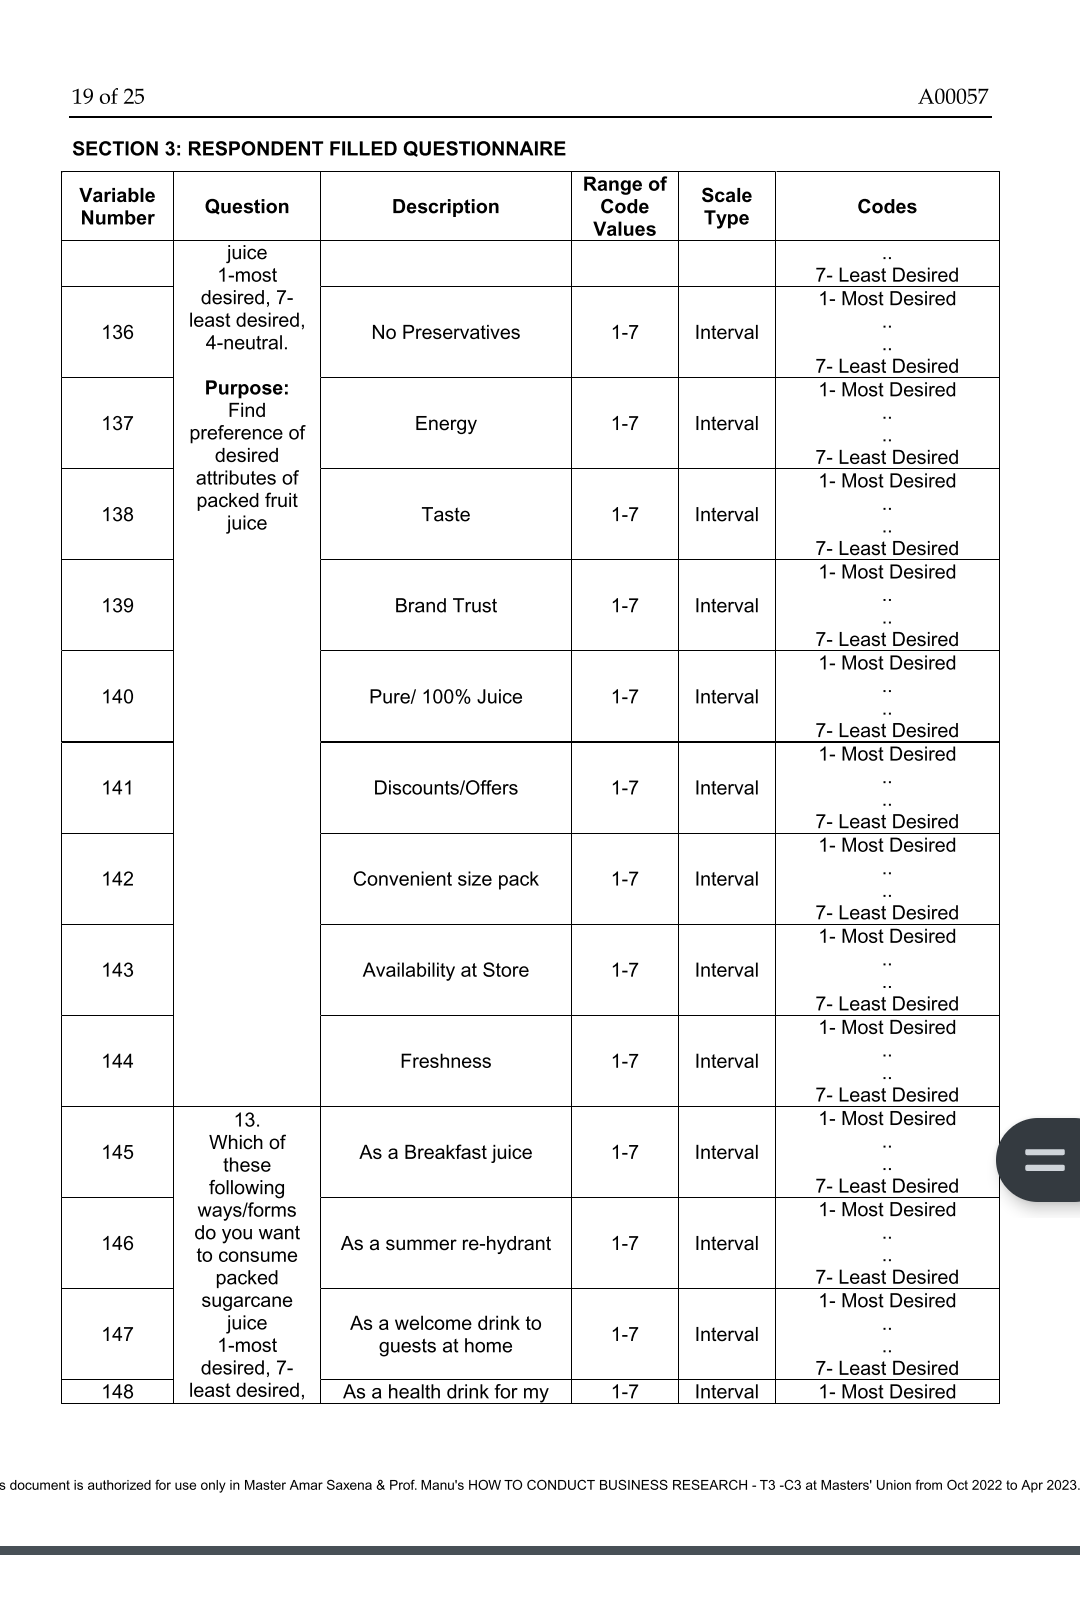
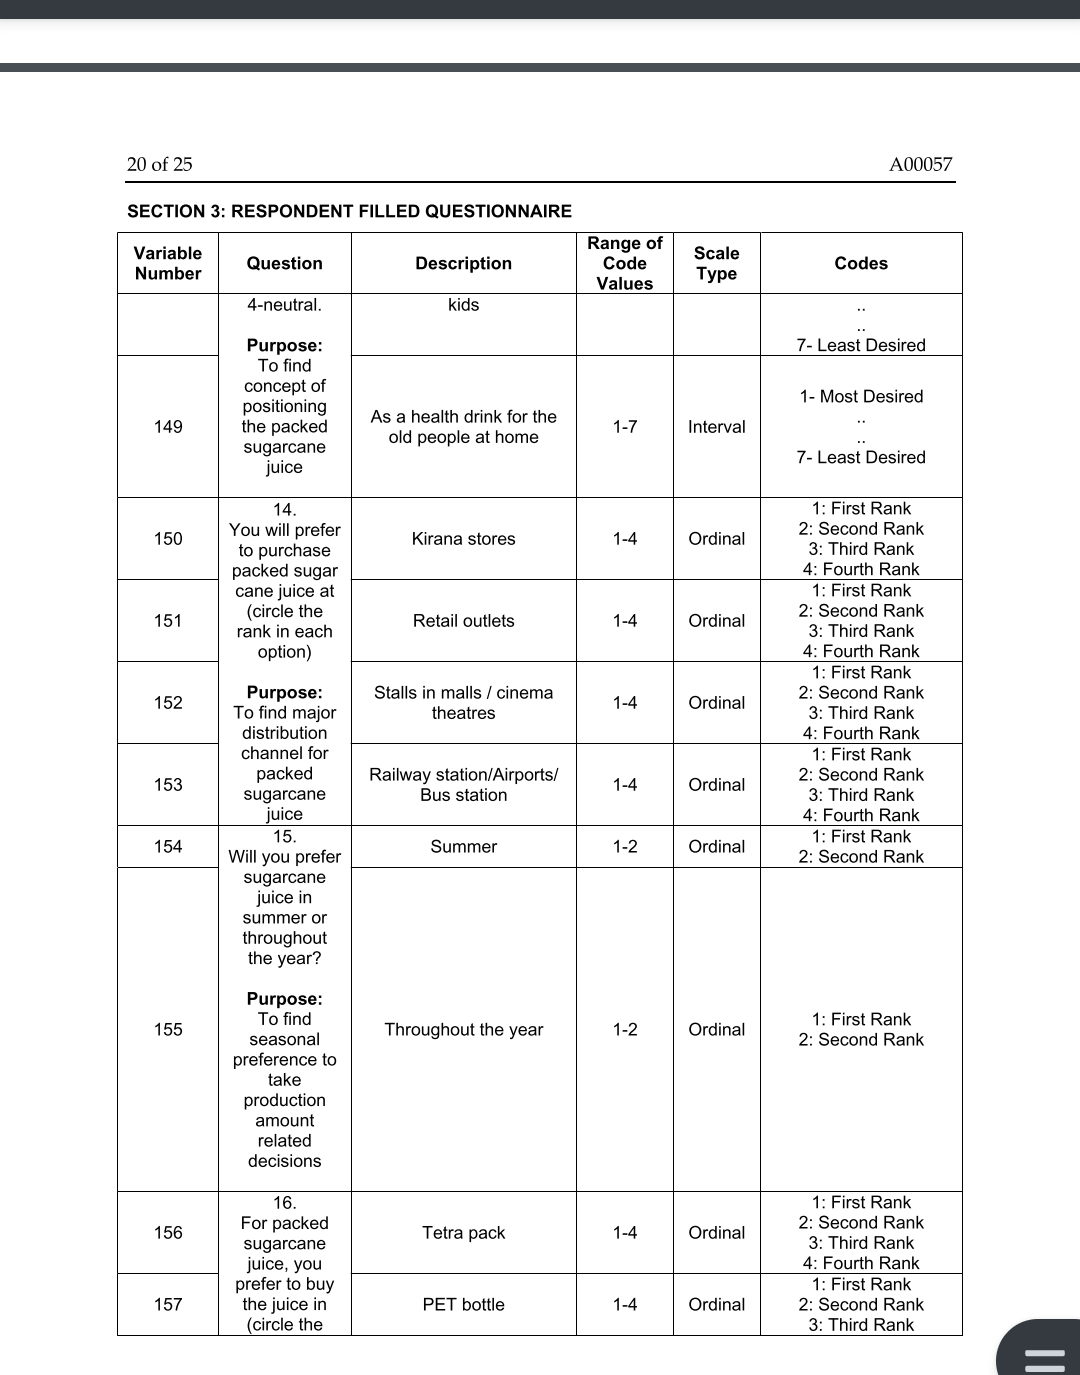
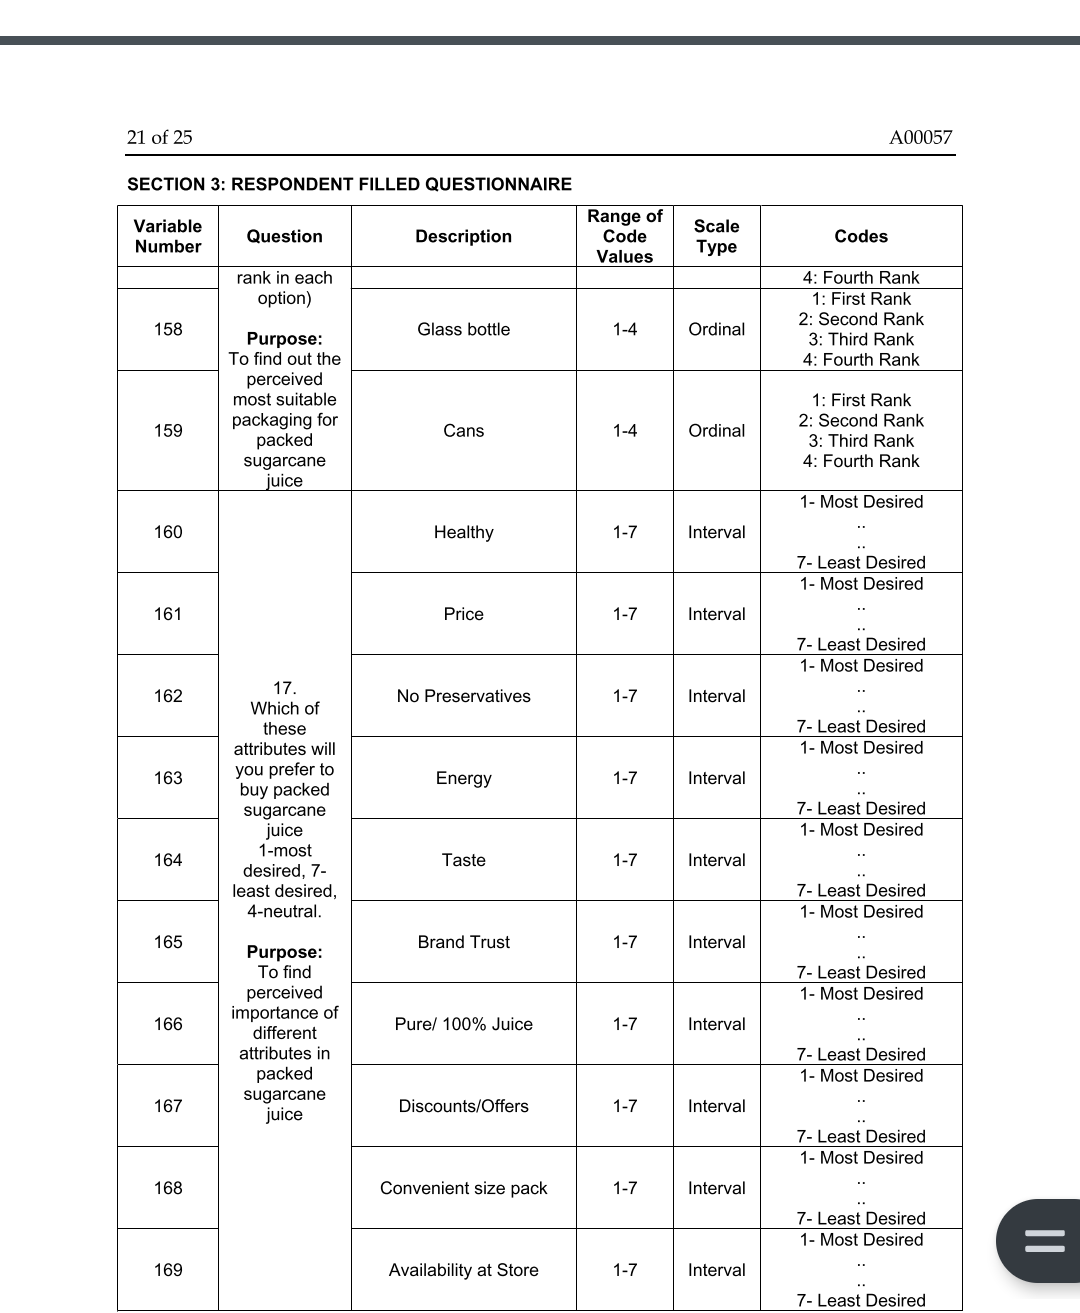
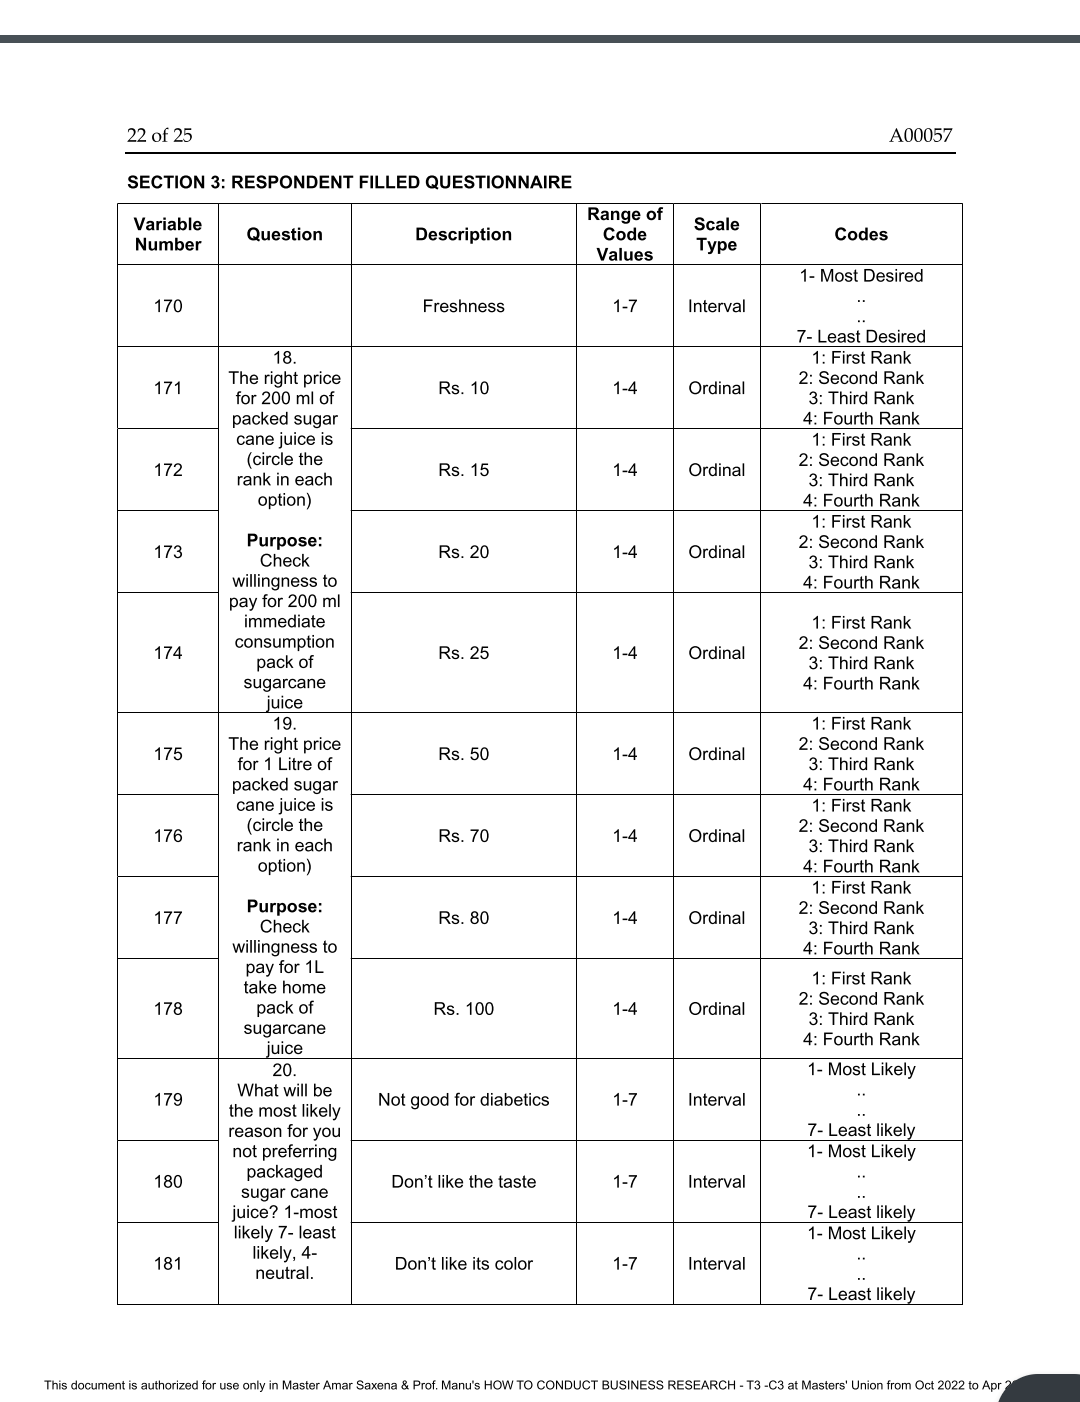
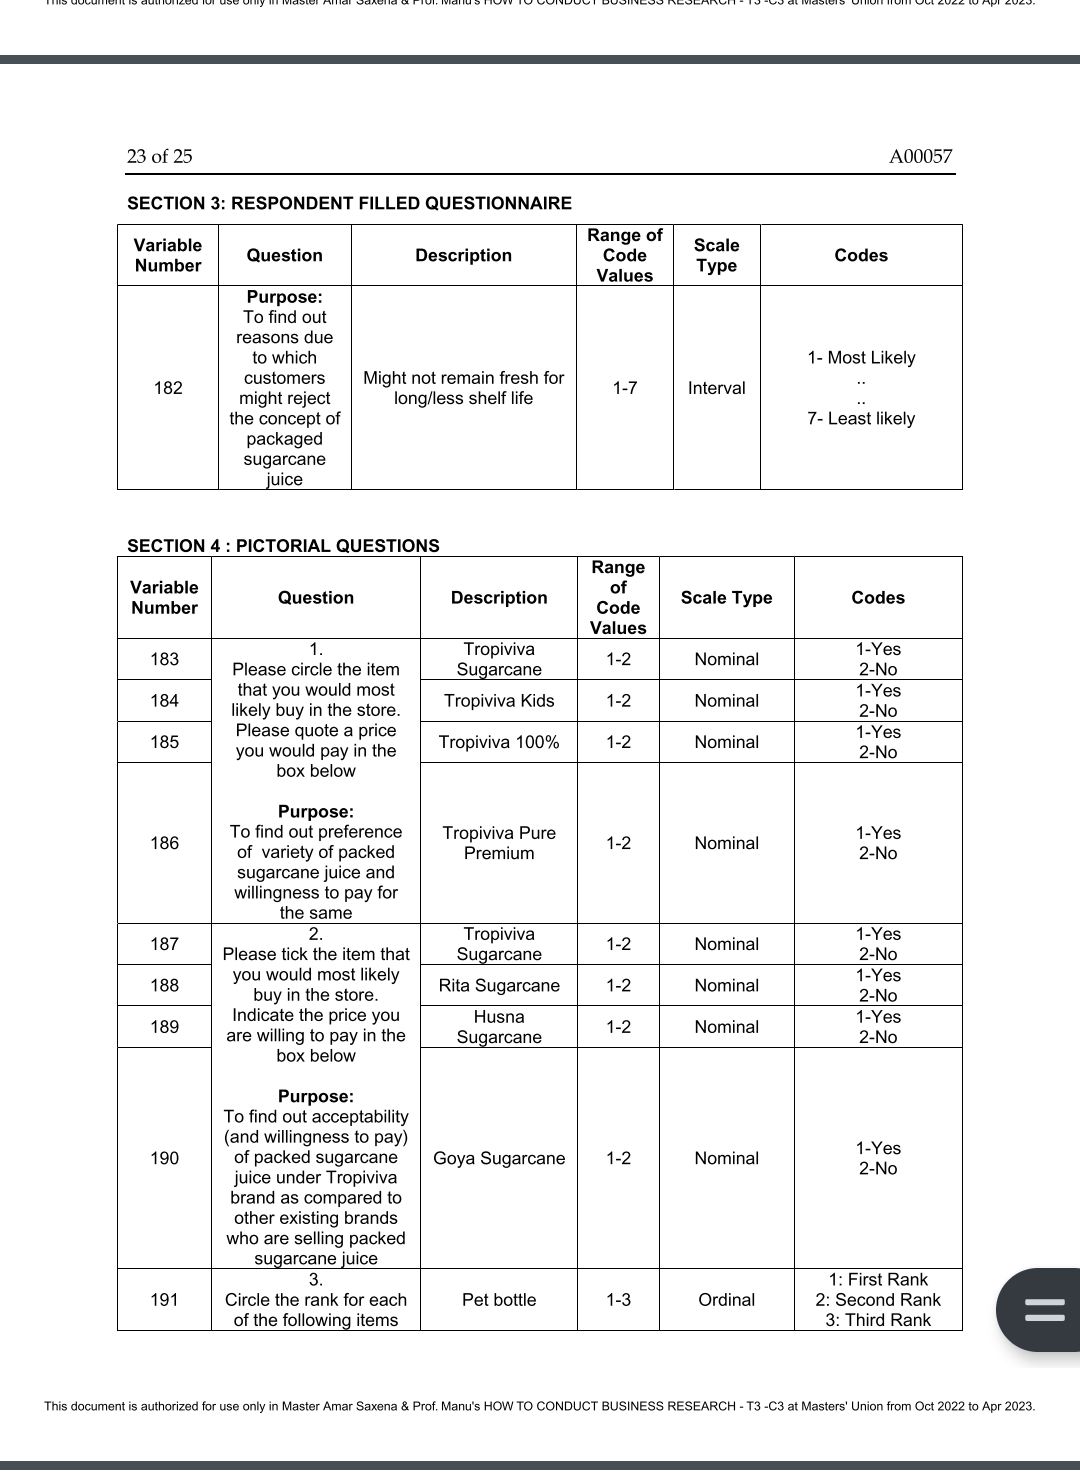
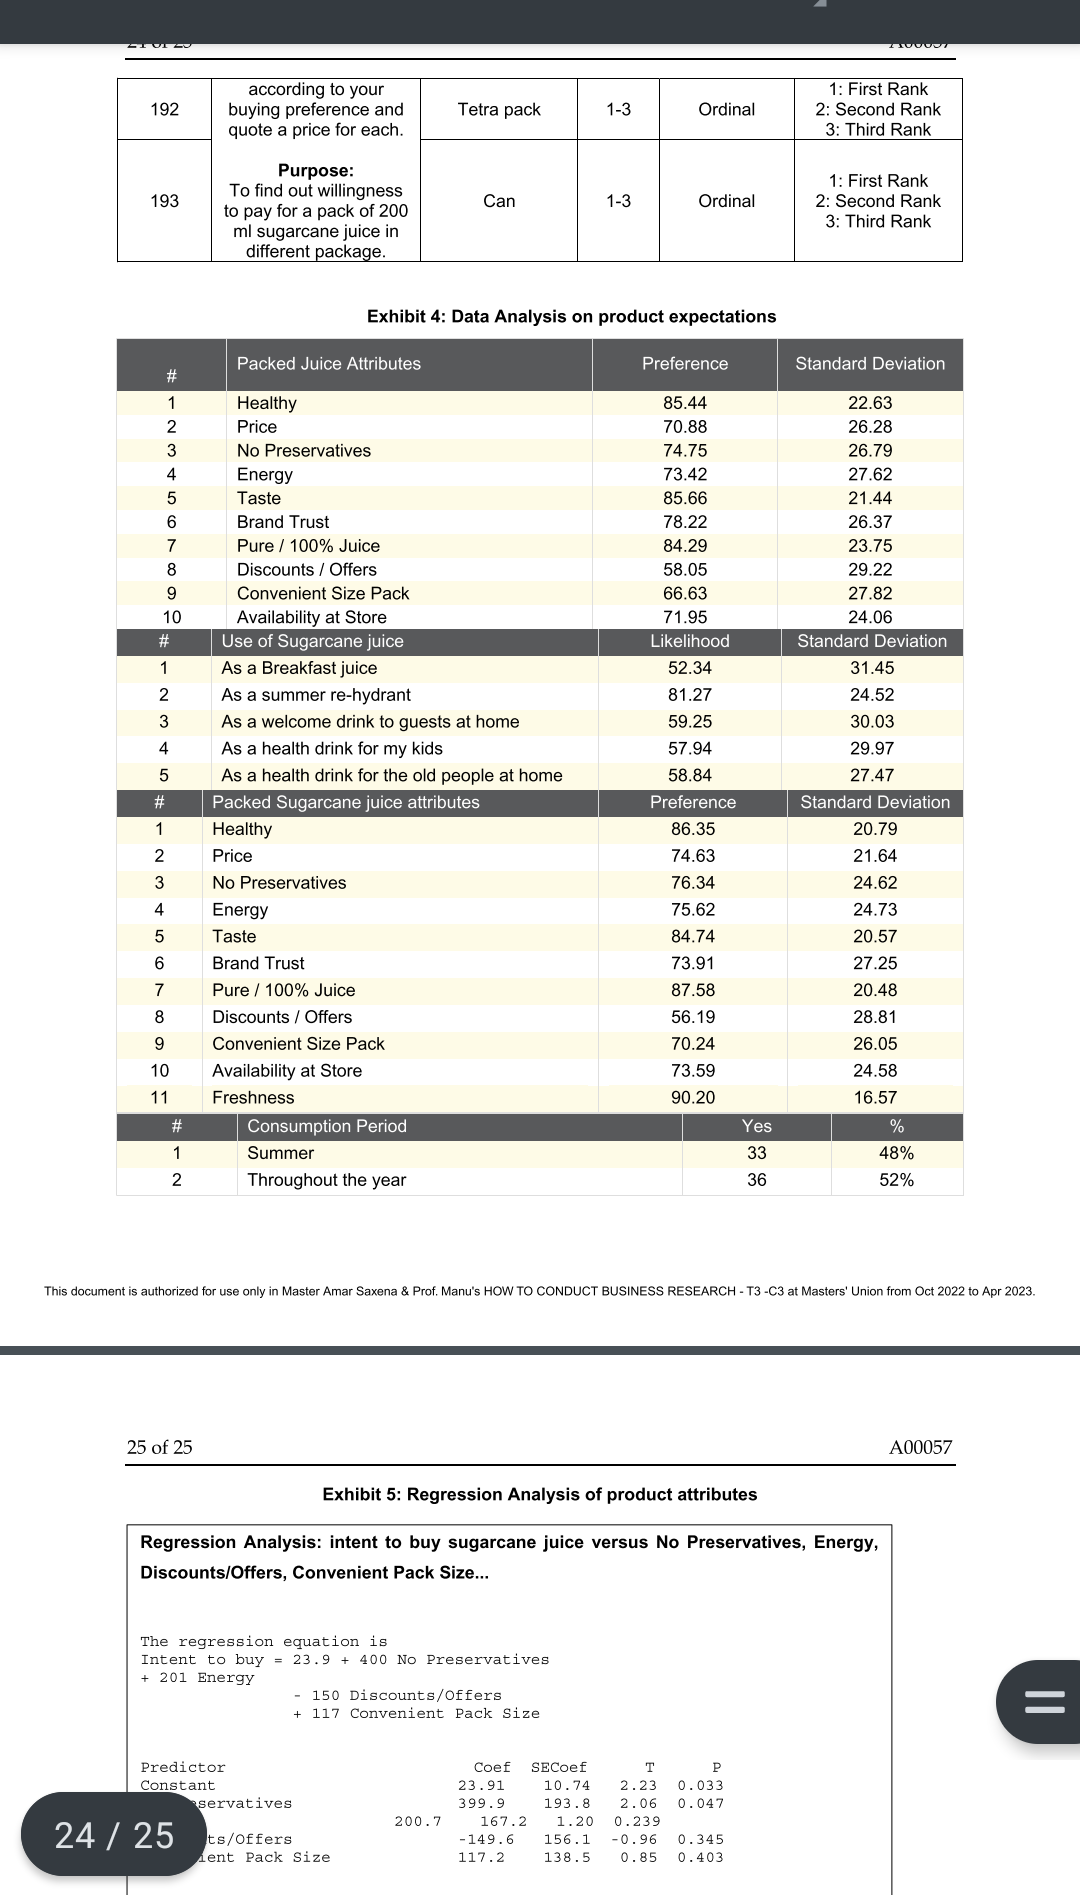
1. Why do you think did the consultants collect both the rating (absolute terms) as well as the ranking data (relative terms) for the importance of different attributes for both willingness to buy and flavour? Was it a redundancy or did it serve some purpose? 2. Was the decision to terminate the questionnaire if the respondents respond to the first question with 'No, I do not prefer to drink packed juices' appropriate? 3. How should the consultants go about preparing a data analysis plan, that is, what is the process they should follow? Is this the right stage for the preparation of a data analysis plan? Fruitzone India Limited (C): Data Collection and Analysis FIL is contemplating the launch of a new sugarcane juice and has entrusted IMI with the market research study. Exploratory research by IMI has shown positive results; IMI had finished the preparation and pretesting of the conclusive research questionnaire. They were ready the data collection process and were employing part time survey collectors for the purpose. Preeti, the marketing manager, had selected the Ahmedabad urban market as the location for the test marketing based on FIL's past experience and also the high consumption of sugarcane juice in the city. Naturally, IMI's initial data collection was limited to Ahmedabad. The idea was to understand if there existed a market for sugarcane juice in Ahmedabad through the conclusive research. If yes, then launch the product in the test market. Further conclusive research would then be done nationwide and then the product would be launched nationally. QUESTIONNAIRE ADMINISTRATION A conclusive research questionnaire was administered by both offline and online survey methods. Offline survey administration was planned at several locations in Ahmedabad such as Reliance Stores at Iskcon Mall, Hypercity at Vastrapur and Alpha One Mall Food Court. Additional locations planned for offline data collection included the Vastrapur lake jogging track with a strong profile of middle and upper middle class adults (timing 6-8 a.m.), the CaneD sugarcane juice outlet and two residential complexes for targeting house wives. In order to ensure utmost professionalism, IMI instructed the survey collectors to adhere strictly to the Market Research Survey of India's guidelines through the process of data collection and processing. This was to ensure that the brand image of Tropiviva was not adversely affected by the market research study. The online survey was designed using Qualtrics online software using the offline questionnaire format designed earlier. The two sections of the offline questionnaire and the screening out process were imitated as we would do in the field survey. However, the 'basic details' questions which were recorded by the survey collector based on observation, were put in towards the end and specific questions to identify whether the survey was online or offline were also added. The online survey forms were distributed via Facebook, LinkedIn and various email groups, and responses were sought. People who responded to the survey request were encouraged to increase the number of responses by posting the links on their Facebook pages. Prepared by Professor Sanjeev Tripathi, Indian Institute of Management, Ahmedabad. The author acknowledges the help and contribution of Kumaravel C (IIMA PGP 2015), and Vishwas Raichur (Academic Associate, IIM Ahmedabad). Cases of the Indian Institute of Management, Ahmedabad, are prepared as a basis for classroom discussion. They are not designed to present illustrations of either correct or incorrect handling of administrative problems. ( 2015 by the Indian Institute of Management, Ahmedabad. ient is authorized for use only in Master Amar Saxena \& Prof. Manu's HOW TO CONDUCT BUSINESS RESEARCH - T3 -C3 at Masters' Union from Oct 2022 to 2 of 25 A00057 Ideally IMI wanted to collect 200 responses so that they had at least 30 respondents in each of the five behavioural classifications. This would enable them to perform statistical tests and derive meaningful conclusions from the survey. However, due to time and resource constraints and the length of the questionnaire, they had a total of 60 surveys. Since the study was only for a test market research for a single city, they decided to proceed with the available data. If this data was positive, test marketing in Ahmedabad would be undertaken by the company and then further country wide research would be done. CODE BOOK FOR QUESTIONNAIRE After entrusting the infield surveys to the survey collectors, IMI began preparing the codebook for the questionnaire. The codebook would be helpful for preparing a data analysis plan and decoding the responses. See Exhibit 3 for the Code Book. CONCERNS During the discussion among the consultants about plans for data analysis, there were concerns about whether they would have adequate responses in each of the behavioural categories, especially because the behavioural classification of the respondent was not as easily determined as the demographic or SEC (socio-economic class) classification, which are done usually concurrently with the survey administration. Behavioural classification requires an analysis of the collected data and then assigning a category to the respondent. The consultants were also considering analysing the data based on demographics also to possibly give better conclusive results. CUSTOMER BEHAVIOURAL CLASSIFICATION The classification questions (Question 4 of the Final Questionnaire) were assigned to the five classification categories, the Information Conscious (IC), Health Conscious (HC), Price Conscious (PC), Convenience Conscious (CC) and Novelty Tryers (NT). The Likert scale data which provided values of 1-5 for strongly agree to strongly disagree with a particular statement was transformed such that a "strongly agree" statement was considered 100%, while "agree" was 75%, "neither agree nor disagree" 50%, "disagree" - 25% and "strongly disagree" - 0%. The average value for all the questions under a particular classification was taken for each respondent and a dominant behavioural classification was assigned to the survey respondent. In case of ties, the category which had the least variation (stdev) was the classification category. DATA ANALYSIS PLAN In order to devise an effective data analysis plan, the consultants revisited the market research study's objectives and mapped the questions in the final survey questionnaire to the study's research questions. The plan was to analyse the responses for each of the questions individually using frequency distribution and visual techniques based on the behavioural classification, and draw inferences. They also decided to identify, using statistical analysis (regression), the various factors that could influence purchase intent such as customer behavioural classification and product attributes. The data analysis and inferences are summarised below. the distribution of the range. See Exhibit 1. 1. What is the target segment for sugarcane juice? The target segment for packed sugarcane juice was determined by comparing the purchase intent (question 6) across the different behavioural classifications of the survey respondents. A regression and correlation analysis was done to determine if specific behavioural traits affected purchase intent. Since there was high correlation between the information conscious and health conscious respondents, these two categories were merged (See Exhibit 2). The low adjusted R2 values suggested that the purchase intent could be linked to a particular segment. The product might serve well for different segments, which could be so for a variety of reasonseeds triggering the purchase. The comparison of the behavioural composition among Tropiviva brand loyalists and respondents with the intent to buy sugarcane juice was similar and hence suggested that the existing Tropiviva target segment was likely to work for the sugarcane juice flavor also. 2. What is the price that the customers are ready to pay for packed sugarcane juice? Questions 10, 11, 18 and 19 were collectively used to answer this research question. For each of the two sizes ( 200ml and 1L) the frequency distribution of respondents ranking the suggested price point high (rank 1 or 2) was calculated for both packed juices and sugarcane juice. A simple comparison suggests that while the general packed juice pricing was between Rs. 15 Rs. 20 , for sugarcane juice it peaked out at Rs. 15. 3. What are expectations from the packed sugarcane juice? Question 12, 13, 14, 15, 17 and 20 were used to understand the desirable and undesirable attributes specific to packed sugarcane juice and packed juices in general. Ratings on a 7point semantic differential scale were converted into percentage values. Higher the percentage value, more preferred is the attribute. The mean and standard deviation of the ratings were computed for each attribute and used to ascertain its relative importance. The relative importance of each of the attributes was used to determine which of them was most valued by the survey respondent. Freshness, health, taste and purity were the key attributes that emerged from the comparison. See Exhibit 4 for detailed results. The consultants wanted to see if the intent to purchase the sugarcane juice was associated with specific product attributes and used a regression analysis for this purpose. The intent to purchase sugarcane juice was taken as the dependent variable and the product attributes were the independent variable. Using the correlation matrix (see below), among multiple product attributes with high correlation, only one of them was selected to enhance the statistical validity of the conclusions. The final regression analysis was done using the attributes No Preservatives, Energy, Discounts/Offers, and Convenient Pack Size. The no preservatives, energy and convenient pack size attributes enhanced the purchase intent, while the discounts/offers reduced the purchase intent. Detailed regression analysis results are shown in Exhibit 5. Correlation Matrix 4. What are the taste variants that customers prefer in sugarcane juice? No data had been collected till then to address this research question. It would be addressed in a subsequent short follow-up survey to test product concepts. Also the consultants were not sure if the customer responses would be accurate unless they actually tried multiple taste variants. 5. Which form would the consumers prefer - can, tetra pack or bottles? The questions 7,8,9 and 16 were used to determine the packaging to be used. The frequency distribution of respondents under each packaging type was computed according to the ranks. A histogram was created for visual comparison. The tetra pack was the most preferred followed by cans as it had the maximum percentage of respondents in the top rank and even if the respondents who ranked it 1 and 2 were combined. INITIAL RECOMMENDATIONS The consultants compiled a preliminary report based on the data analysis to be sent to Preeti. According to them, the product was feasible as the size of the target market was substantially large, and the willingness to buy was evident through the responses. Compared to the juice market, the purchase intent for packaged sugarcane (43\%) was only marginally lower than the overall average (57\%). As all categories (behavioural classification) of customers showed a healthy purchasing intent for almost similar reasons, the consultants recommended a product positioning based on product attributes. This would help Tropiviva target the entire packed juice consumer market. 'Purity', 'healthy' and 'tasty' were recommended as product attributes to be used in the positioning. Further, specific attention needed to be paid to the package size as it was determined critical for respondents. A small pack size (200ml) in tetra packs was recommended with a pricing (Rs.15) lower than existing Tropiviva juices (Rs.20). Larger package sizes were not recommended at least during the launch because customer price discount expectations on larger packs were high and this would be less profitable. The consultants also recommended an additional survey for concept testing so as to enable them to perform a conjoint analysis and figure out the best combination of is document is authorized for use only in Master Amar Saxena \& Prof. Manu's HOW TO CONDUCT BUSINESS RESEARCH - T3 -C3 at Masters' Union from Oct 2022 to Apr 2023. product attributes. In order to identify the taste variants, they suggested that a blinded taste study be done at an existing sugarcane juice retail outlet, to identify the preferred taste variants. Further, a more conclusive testing of the purchase intent was suggested to confirm the survey findings and also make a more accurate demand estimation of the product launch market. In brief, the consultants recommended that the product development team go ahead with the development keeping the key product attributes in mind. Their further research proposal included their request for a simulated market study, a blinded taste testing and concept testing. Exhibit 1 Willingess to try a particular juice flavor in packed form Willingess to buy a particular juice flavor in packed form nis document is authorized for use only in Master Amar Saxena \& Prof. Manu's HOW TO CONDUCT BUSINESS RESEARCH - T3 -C3 at Masters' Union from Oct 2022 to Ap 9 of 25 A00057 EXHIBIT 3: Code Book for the Questionnaire SECTION 1: SCREENING \&RESPONDENT BASIC DETAILS SECTION 3: RESPONDENT FILLED QUESTIONNAIRE Iment is authorized for use only in Master Amar Saxena \& Prof. Manu's HOW TO CONDUCT BUSINESS RESEARCH - T3 -C3 at Masters' Union from Oct 2022 to Apr 11 of 25 A00057 SECTION 3: RESPONDENT FILLED QUESTIONNAIRE Iment is authorized for use only in Master Amar Saxena \& Prof Manu's HOW TO conDUCT Business RESEARCH - -T3 -C3 at Masters' Union from Oct 2022 to A 13 of 25 A00057 SECTION 3: RESPONDENT FILLED QUESTIONNAIRE 14 of 25 A00057 SECTION 3: RESPONDENT FILLED QUESTIONNAIRE 15 of 25 A00057 SECTION 3: RESPONDENT FILLED QUESTIONNAIRE s document is authorized for use only in Master Amar Saxena \& Prof. Manu's HOW TO CONDUCT BUSINESS RESEARCH - T3 -C3 at Masters' Union from Oct 2022 to Apr 202 17 of 25 A00057 SECTION 3: RESPONDENT FILLED QUESTIONNAIRE s document is authorized for use only in Master Amar Saxena \& Prof. Manu's HOW TO CONDUCT BUSINESS RESEARCH - T3 -C3 at Masters' Union from Oct 2022 to Apr 202 18 of 25 A 00057 s document is authorized for use only in Master Amar Saxena \& Prof. Manu's HOW TO CONDUCT BUSINESS RESEARCH - T3 -C3 at Masters' Union from Oct 2022 to Apr 202 19 of 25 A00057 SECTION 3: RESPONDENT FILLED QUESTIONNAIRE 20 of 25 A00057 SECTION 3: RESPONDENT FILLED QUESTIONNAIRE 21 of 25 A00057 SECTION 3: RESPONDENT FILLED QUESTIONNAIRE 22 of 25 A00057 SECTION 3: RESPONDENT FILLED QUESTIONNAIRE This document is authorized for use only in Master Amar Saxena \& Prof. Manu's HOW TO CONDUCT BUSINESS RESEARCH - T3 -C3 at Masters' Union from Oct 2022 to Apr 2023. Exhibit 4: Data Analysis on product expectations This document is authorized for use only in Master Amar Saxena \& Prof. Manu's HOW TO CONDUCT BUSINESS RESEARCH - T3 -C3 at Masters' Union from Oct 2022 to Apr 2023. 25 of 25 A00057 Exhibit 5: Regression Analysis of product attributes Regression Analysis: intent to buy sugarcane juice versus No Preservatives, Energy, Discounts/Offers, Convenient Pack Size... The regression equation is Intent to buy =23.9+400 No Preservatives +201 Energy - 150 Discounts/offers +117 Convenient Pack Size
Step by Step Solution
There are 3 Steps involved in it
1 Expert Approved Answer
Step: 1 Unlock

Question Has Been Solved by an Expert!
Get step-by-step solutions from verified subject matter experts
Step: 2 Unlock
Step: 3 Unlock