

Question: ANSWER THE ALL QUESTIONS TOPIC: Enhancing Customer Experience Through Sentiment Analysis Complete the Project with that topic Hopefully, you have identified the data science problem
ANSWER THE ALL QUESTIONS
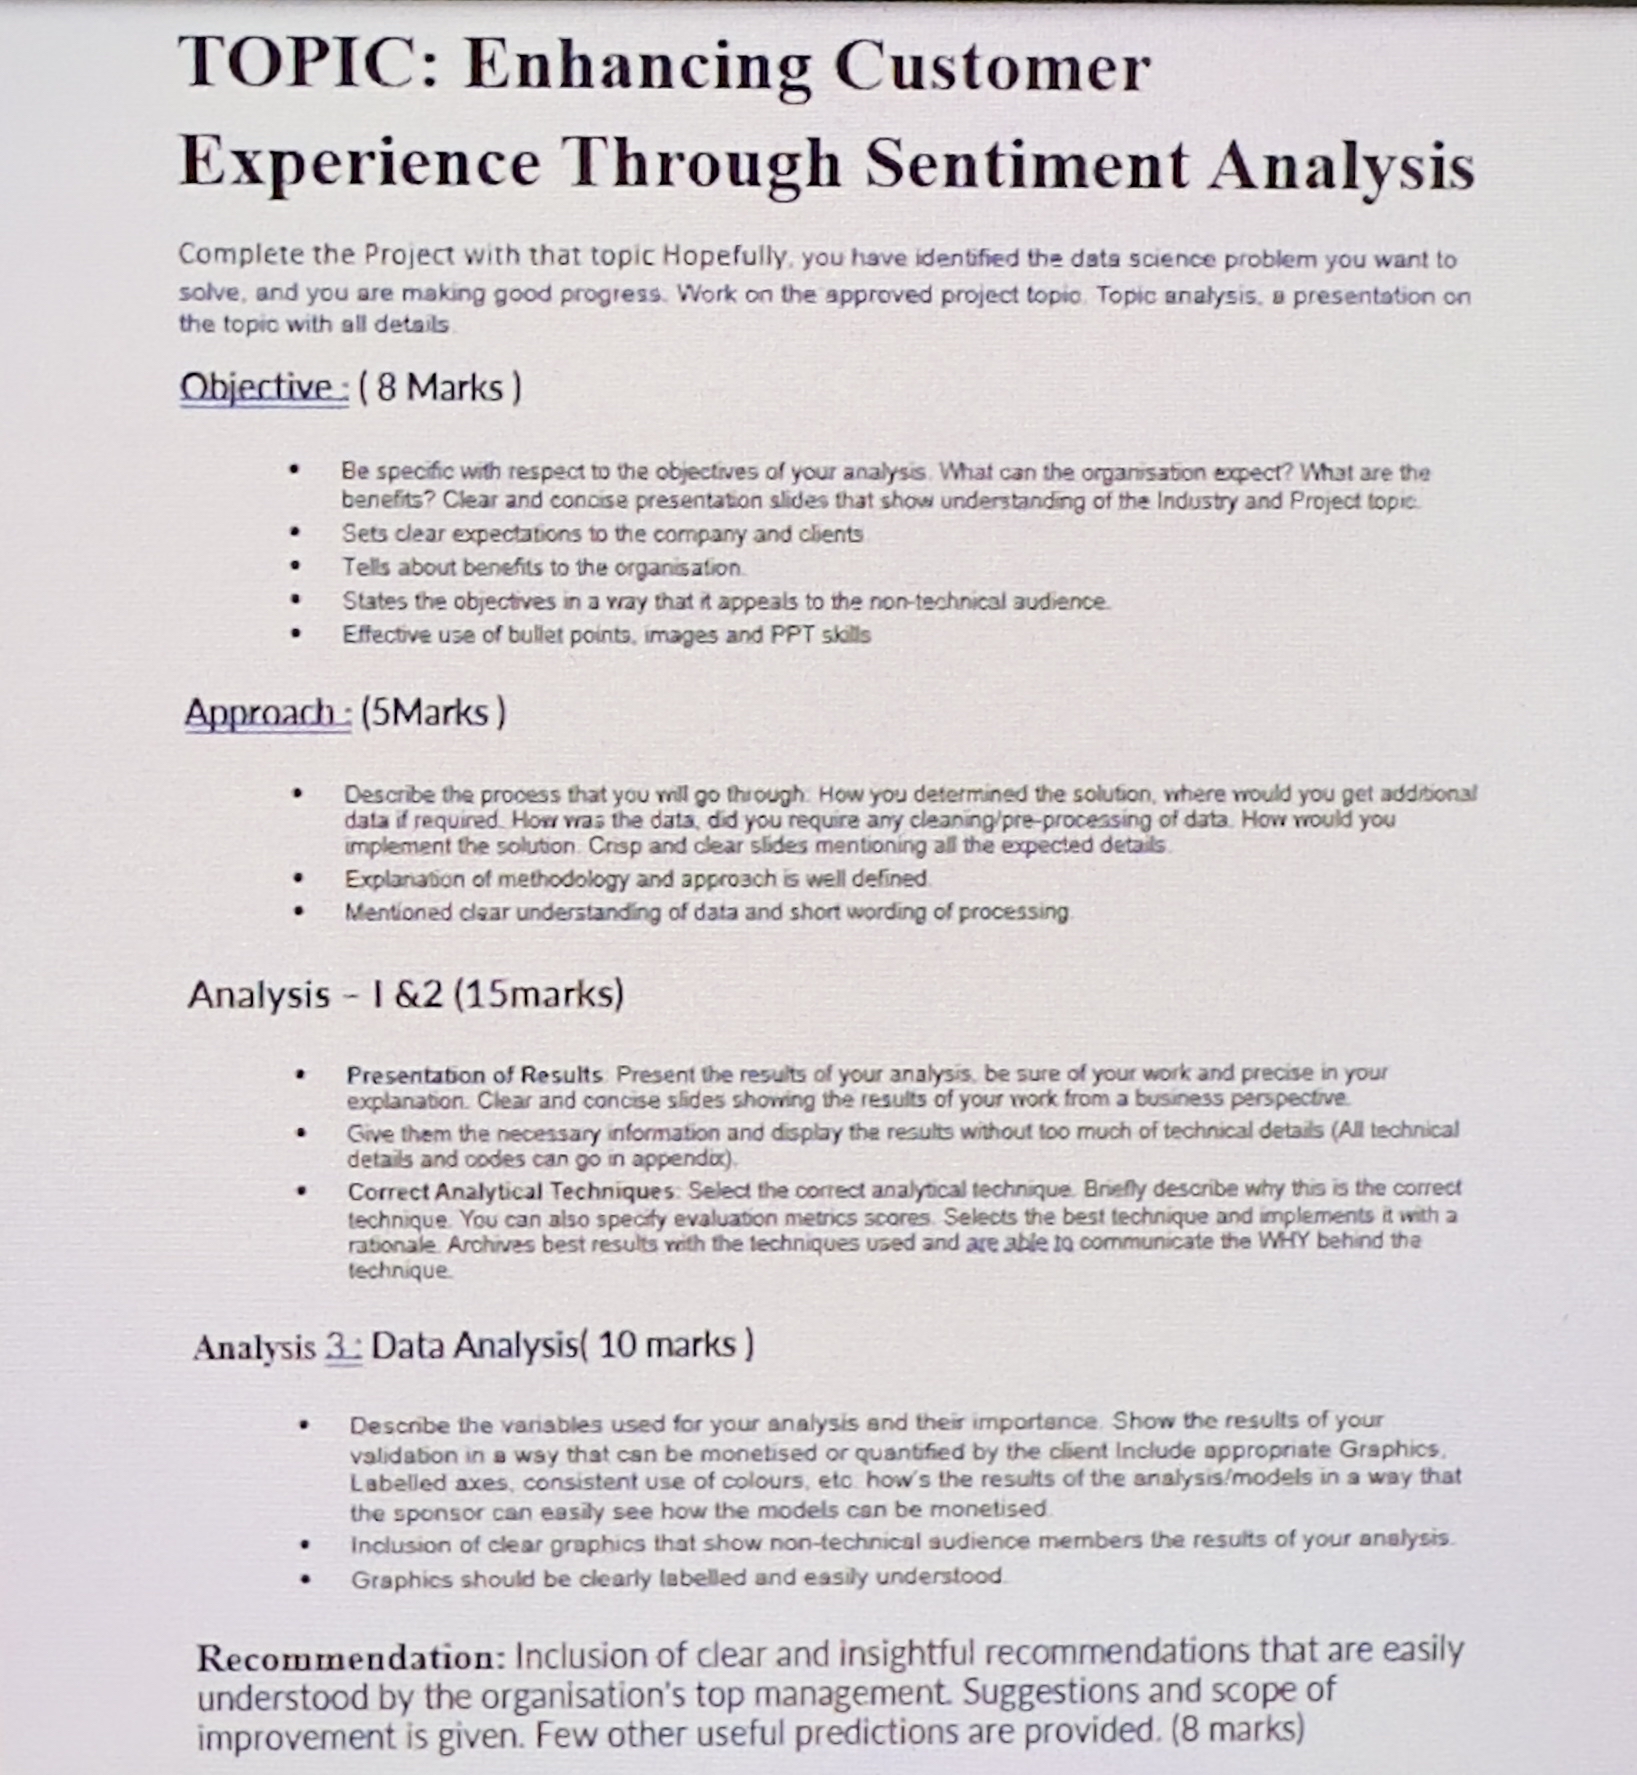
TOPIC: Enhancing Customer
Experience Through Sentiment Analysis
Complete the Project with that topic Hopefully, you have identified the data science problem you want to solve, and you are making good progress. Work on the approved project topic. Topic analysis, a presentation on the topio with all details
Objective: Marks
Be specific with respect to the objectives of your analysis. What can the organisation expect? What are the benefits? Clear and concise presentation slides that show understanding of the Industry and Project topic:
Sets clear expectations to the company and clients
Tells about benefits to the organisation.
States the objectives in a wray that it appeals to the nontechnical audience.
Effective use of bullet points, images and PPT skolls
Approach: Marks
Describe the process that you mill go through. How you determined the solution, where would you get additional data if required. How was the data, did you require any cleaningpreprocessing of data. How would you implement the solution. Crisp and clear slides mentioning all the expected details.
Explanation of methodology and approzch is well defined
Mentioned claar understanding of data and short wording of processing
Analysis I & marks
Presentation of Results. Present the results of your analysis, be sure of your work and precise in your explanation. Clear and concise slides showing the results of your work from a business perspective.
Give them the necessary information and display the results without much of technical details All lechnical details and oodes can go in appendia
Correct Analytical Techniques: Select the correct analytical technique. Briefly describe why this is the correct technique You can also specity evaluation metrics scores. Selects the best technique and implements it with a ratonale. Archives best results with the lechniques used and are able to communicate the WHY behind the technique.
Analysis : Data Analysis marks
Describe the variables used for your analysis and their importance. Show the results of your validation in a way that can be monetised or quantified by the client Include appropriate Graphics. Labelled axes, consistent use of colours, eto how's the results of the analysismodels in a way that the sponsor can easily see how the models can be monetised.
Inclusion of clear graphics that show nontechnical audience members the results of your analysis.
Graphics should be clearly labelled and easily understood.
Recommendation: Inclusion of clear and insightful recommendations that are easily understood by the organisation's top management. Suggestions and scope of improvement is given. Few other useful predictions are provided. marks
Step by Step Solution
There are 3 Steps involved in it
1 Expert Approved Answer
Step: 1 Unlock

Question Has Been Solved by an Expert!
Get step-by-step solutions from verified subject matter experts
Step: 2 Unlock
Step: 3 Unlock