

Question: Answer the document and give me an example of from this document that helps gdp tell the right story GDP Mini-Q Document C Source: Chart
Answer the document and give me an example of from this document that helps gdp tell the right story
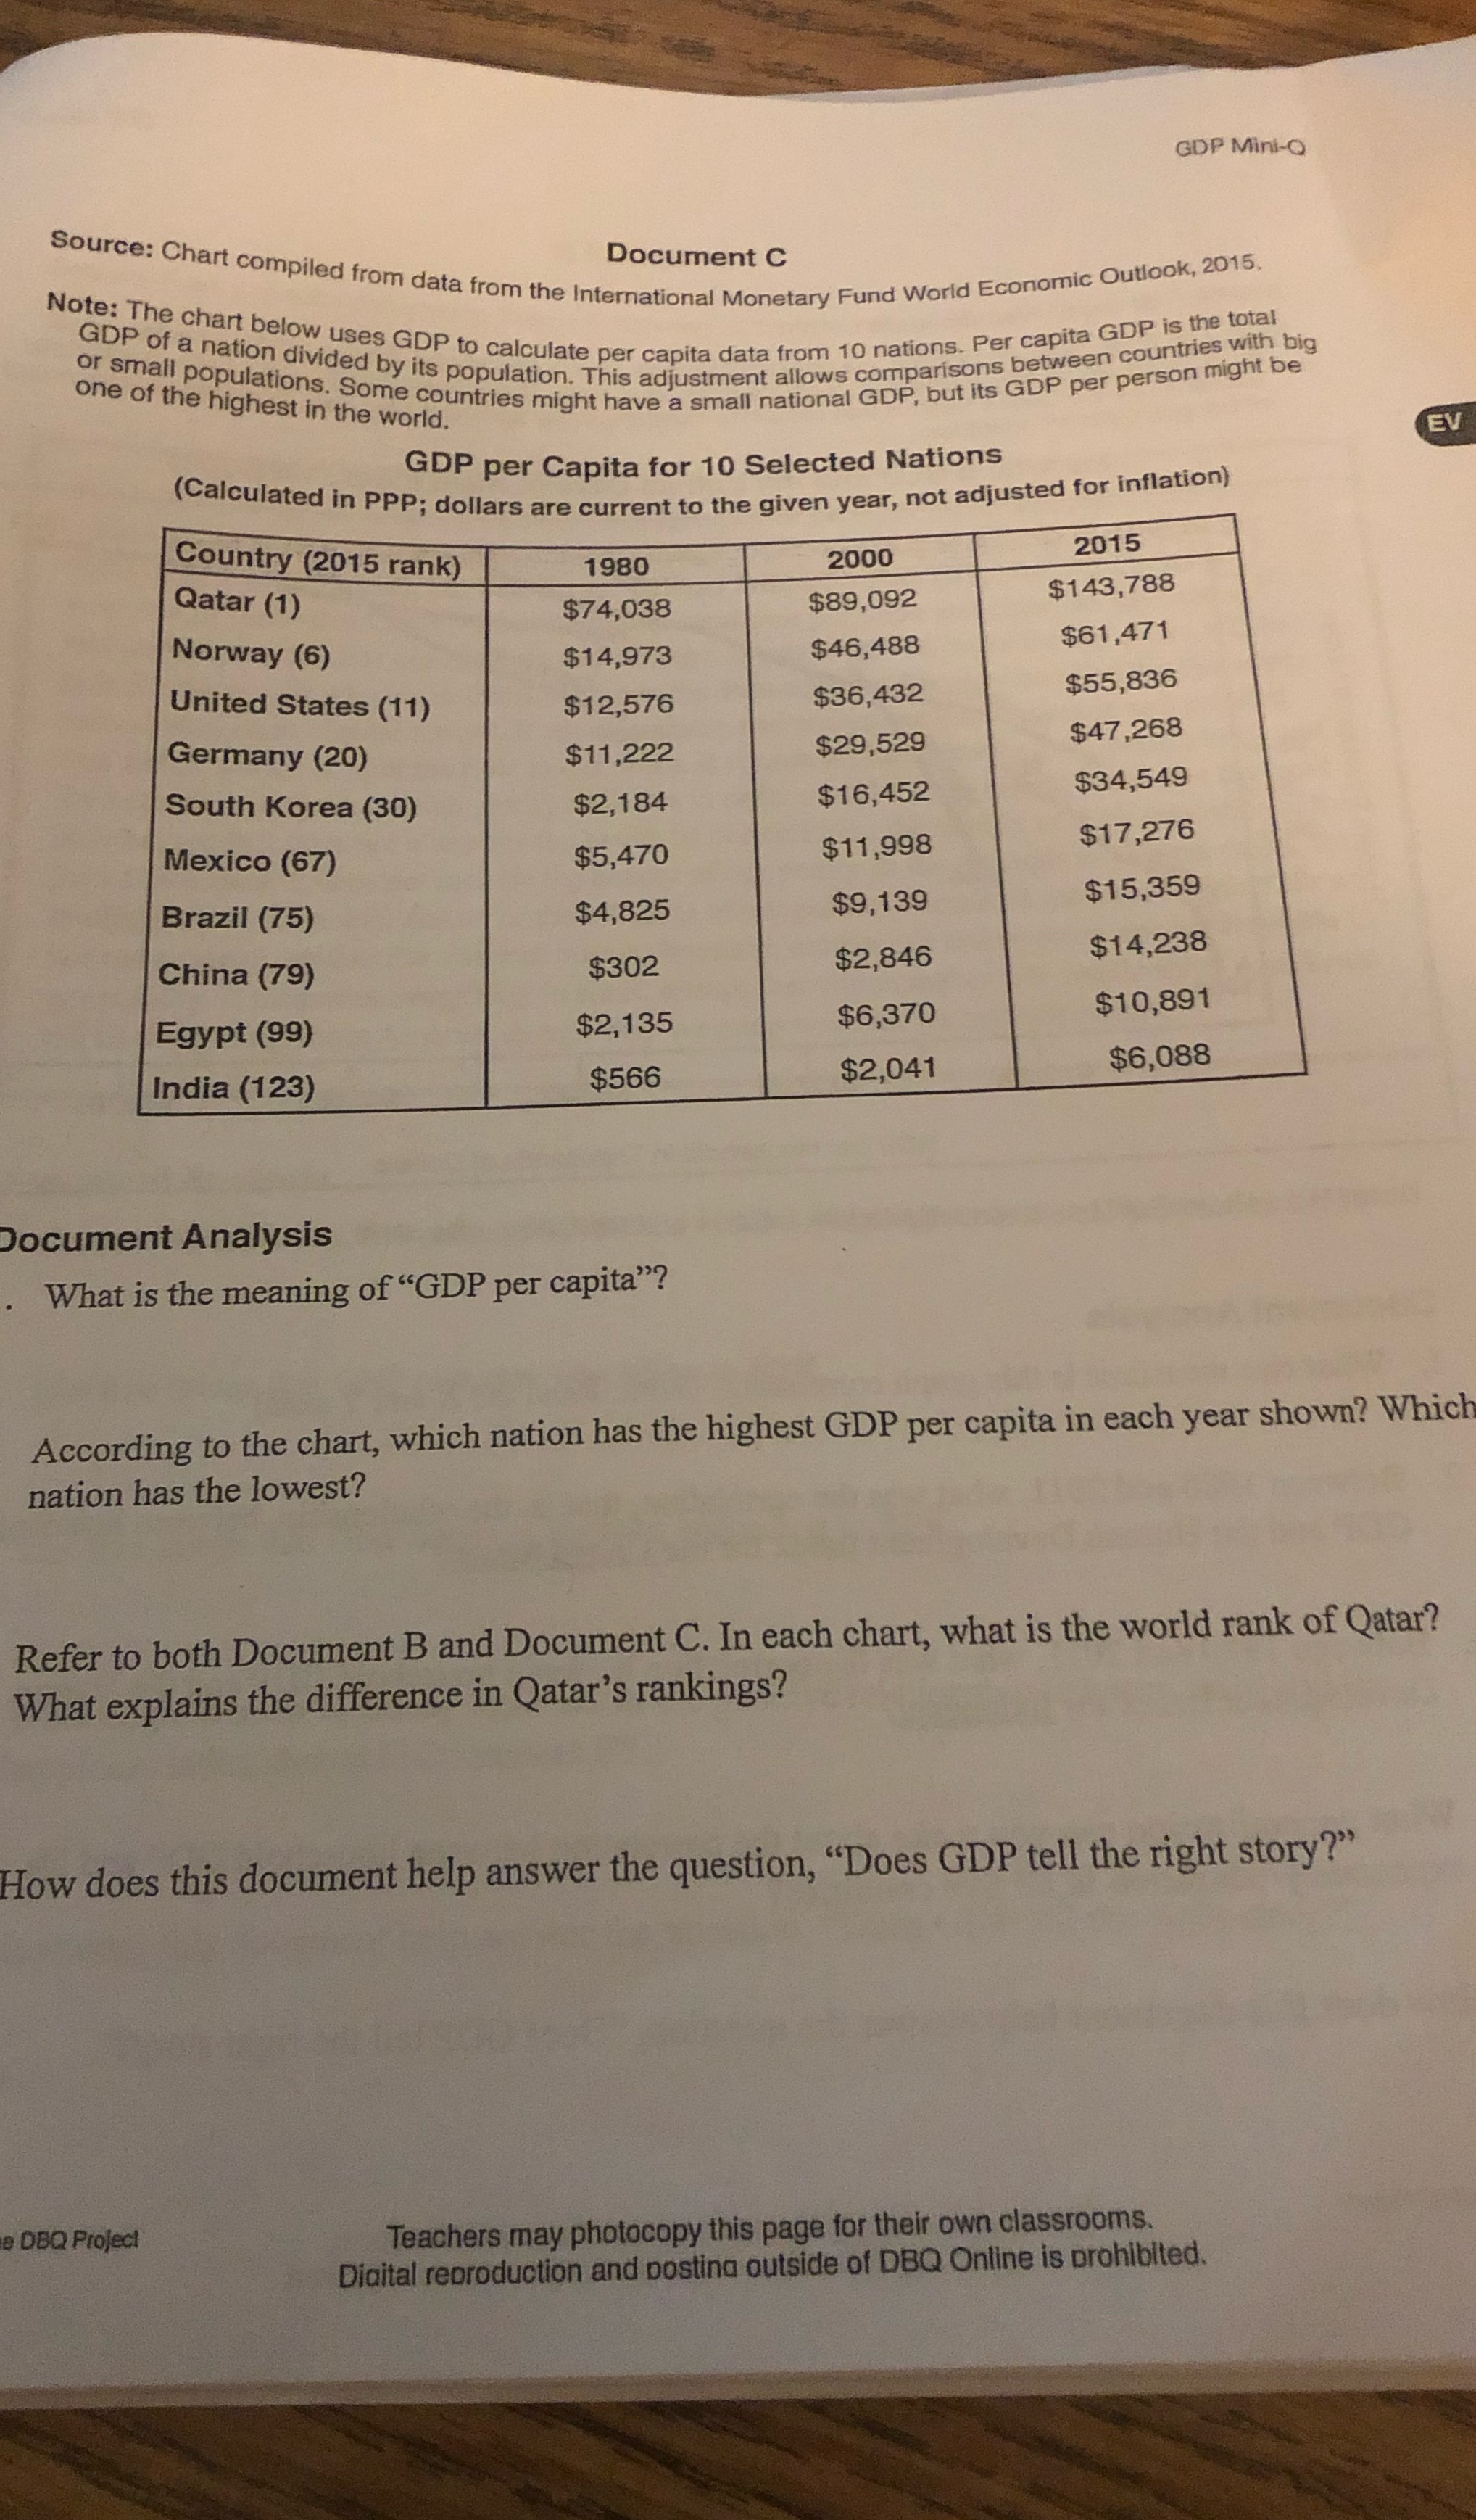
GDP Mini-Q Document C Source: Chart compiled from data from the International Monetary Fund World Economic Outlook, 2015, Note: The chart below uses GDP to calculate per capita data from 10 nations. Per capita GDP is the total GDP of a nation divided by its population. This adjustment allows comparisons between countries with big or small populations. Some countries might have a small national GDP, but its GDP per person might be one of the highest in the world. GDP per capita for 10 Selected Nations (Calculated in PPP; dollars are current to the given year, not adjusted for inflation) EV Country (2015 rank) 1980 2000 Qatar (1) $74,038 $89,092 2015 $143,788 Norway (6) $14,973 $46,488 $61,471 United States (11) $12,576 $36,432 $55,836 Germany (20) $11,222 $29,529 $47,268 South Korea (30) $2,184 $16,452 $34,549 Mexico (67) $5,470 $11,998 $17,276 Brazil (75) $4,825 $9,139 $15,359 China (79) $302 $2,846 $14,238 Egypt (99) $2,135 $6,370 $10,891 India (123) $566 $2,041 $6,088 Document Analysis What is the meaning of "GDP per capita"? According to the chart, which nation has the highest GDP per capita in each year shown? Which nation has the lowest? Refer to both Document B and Document C. In each chart, what is the world rank of Qatar? What explains the difference in Qatar's rankings? How does this document help answer the question, "Does GDP tell the right story?" e DBQ Project Teachers may photocopy this page for their own classrooms. Digital reproduction and posting outside of DBQ Online is prohibited.
Step by Step Solution
There are 3 Steps involved in it

Get step-by-step solutions from verified subject matter experts