Question: Answer the even number questions only. 2, 4, 6, 8, 10, 12, 14, 16, and 18. Show your work. 1.5 Practice wr CalcChat' AND CalcView
Answer the even number questions only. 2, 4, 6, 8, 10, 12, 14, 16, and 18. Show your work.
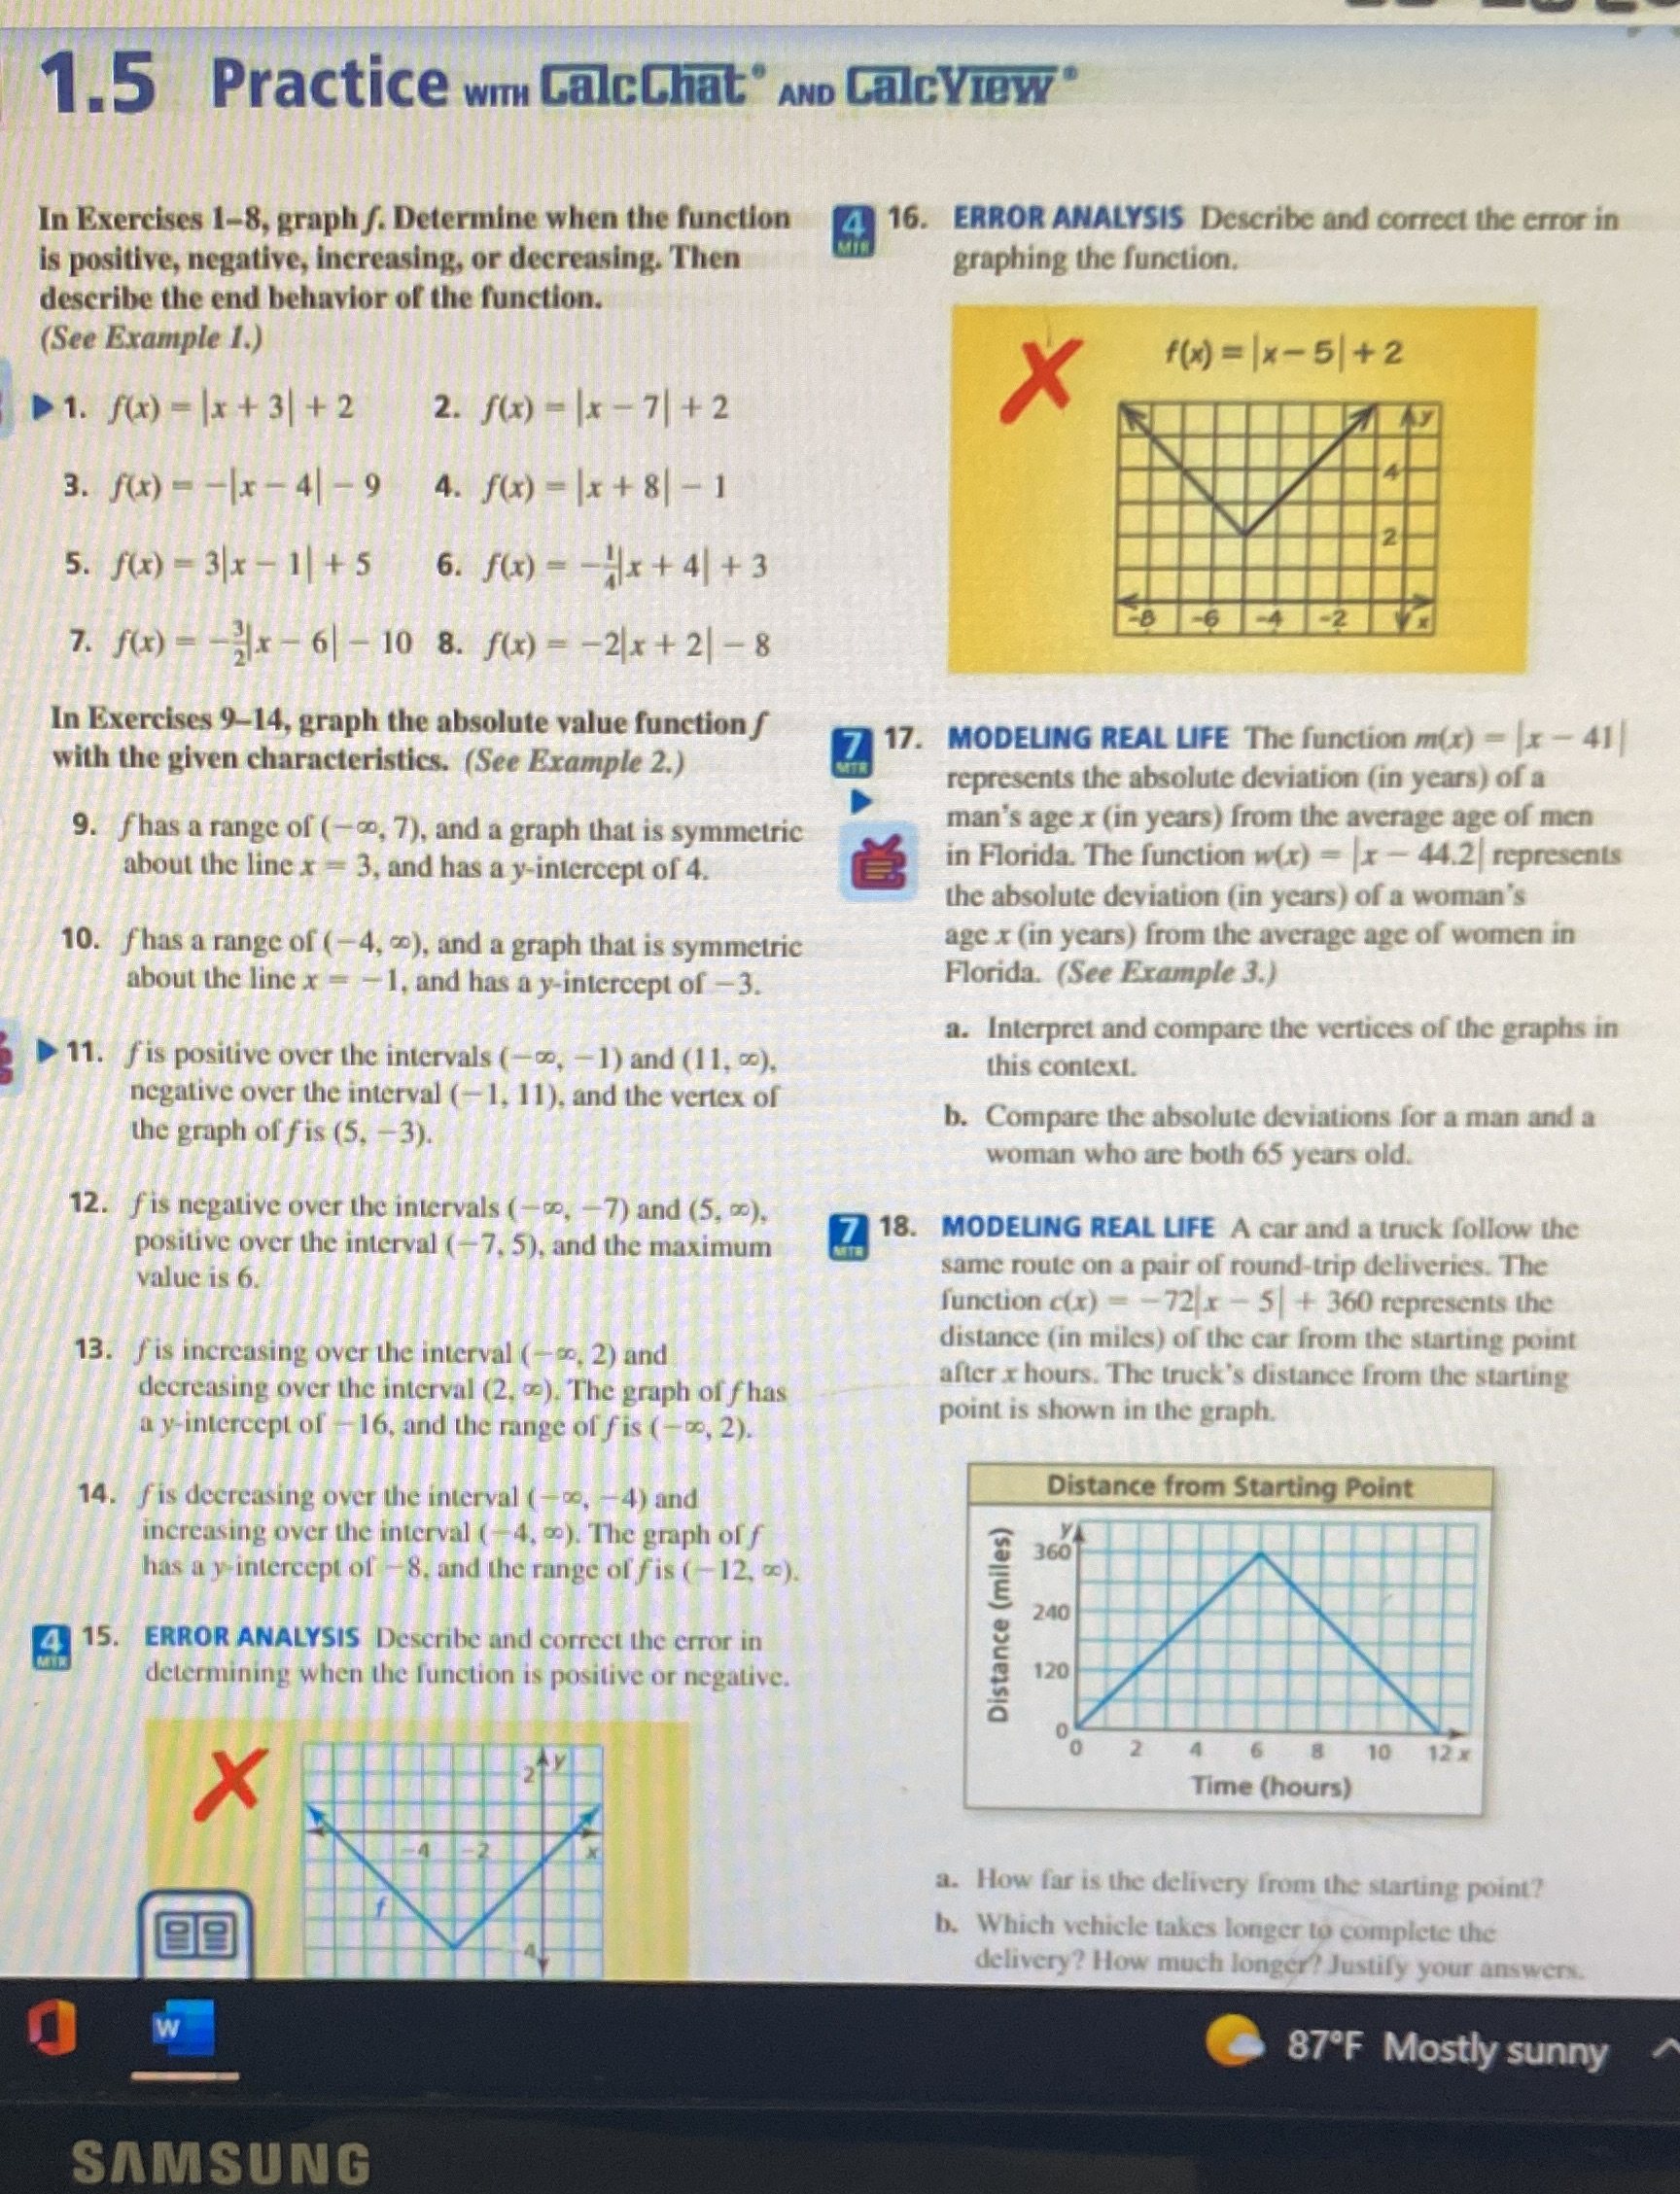
1.5 Practice wr CalcChat' AND CalcView" In Exercises 1-8, graph f. Determine when the function 16. ERROR ANALYSIS Describe and correct the error in is positive, negative, increasing, or decreasing. Then graphing the function. describe the end behavior of the function. (See Example 1.) X f ( x ) = 1x-5+2 D 1. f(x) - |x + 3| + 2 2. f (x ) - 1x - 71+ 2 3. f(x) - -|x - 41 - 9 4. f(x) - |x + 81 - 1 5 . f (x ) - 3 / x - 1| + 5 6. f( x ) - - 4x + 41+ 3 7. f(x) - x - 6 - 10 8. f(x) = -2/x + 21 -8 In Exercises 9-14, graph the absolute value function f with the given characteristics. (See Example 2.) 7 17. MODELING REAL LIFE The function m(x) - |x - 41 represents the absolute deviation (in years) of a 9. fhas a range of (-co, 7), and a graph that is symmetric man's age x (in years) from the average age of men about the line x - 3, and has a y-intercept of 4. in Florida. The function w(x) = x - 44.2 represents the absolute deviation (in years) of a woman's 10. fhas a range of (-4, co), and a graph that is symmetric age x (in years) from the average age of women in about the line x - -1, and has a y-intercept of -3. Florida. (See Example 3.) a. Interpret and compare the vertices of the graphs in 11. f is positive over the intervals (-co, -1) and (11, co), this context. negative over the interval (-1, 11), and the vertex of the graph of fis (5, -3). b. Compare the absolute deviations for a man and a woman who are both 65 years old. 12. fis negative over the intervals (-to, -7) and (5, Do), positive over the interval (#7. 5), and the maximum 7 18. MODELING REAL LIFE A car and a truck follow the value is 6. same route on a pair of round-trip deliveries. The Junction c(x) - -72 x - 5 + 360 represents the 13. f is increasing over the interval (- co. 2) and distance (in miles) of the car from the starting point decreasing over the interval (2. ). The graph of fhas after x hours. The truck's distance from the starting a y-intercept of -16, and the range of fis ( Do, 2). point is shown in the graph. f is decreasing over the interval (-co, -4) and Distance from Starting Point increasing over the interval ( 4, po). The graph of f 360 has a y intercept of -8. and the range of fis ( -12, wc). 240 Distance (miles) 4 15. ERROR ANALYSIS Describe and correct the error in determining when the function is positive or negative. 120 8 10 12 X X Time (hours) a. How far is the delivery from the starting point? b. Which vehicle takes longer to complete the delivery? How much longer? Justify your answers. O 87'F Mostly sunny SAMSUNG