

Question: answer the following. After answering the question, can you wright down the process of using the calculator, 19.4 19.1 23.] 21.8 23.4 17.1 iii. (4.6)
answer the following.
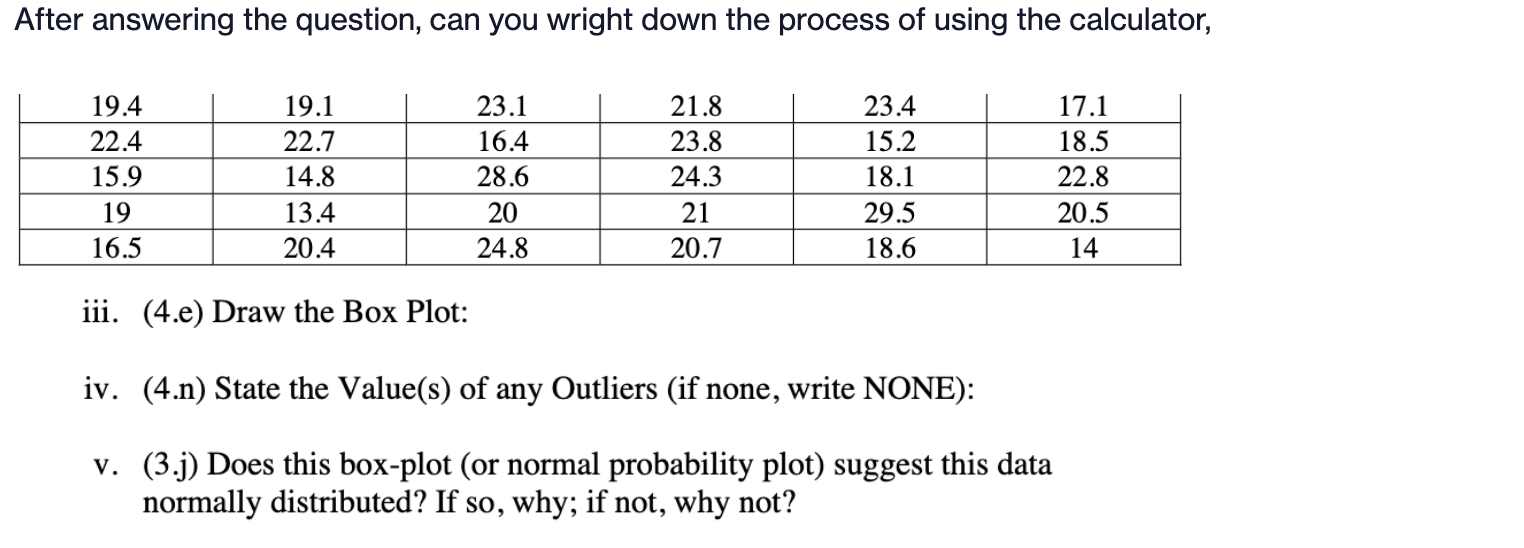
After answering the question, can you wright down the process of using the calculator, 19.4 19.1 23.] 21.8 23.4 17.1 iii. (4.6) Draw the Box Plot: iv. (4.n) State the Value(s) of any Outliers (if none, write NONE): v. (3 .j) Does this box-plot (or normal probability plot) suggest this data normally distributed? If so, why; if not, why not
Step by Step Solution
There are 3 Steps involved in it
1 Expert Approved Answer
Step: 1 Unlock

Question Has Been Solved by an Expert!
Get step-by-step solutions from verified subject matter experts
Step: 2 Unlock
Step: 3 Unlock