

Question: answer the following Consider the same data as in Question 1, which is used to generate a scatterplot of listings vs sales figures given below.
answer the following
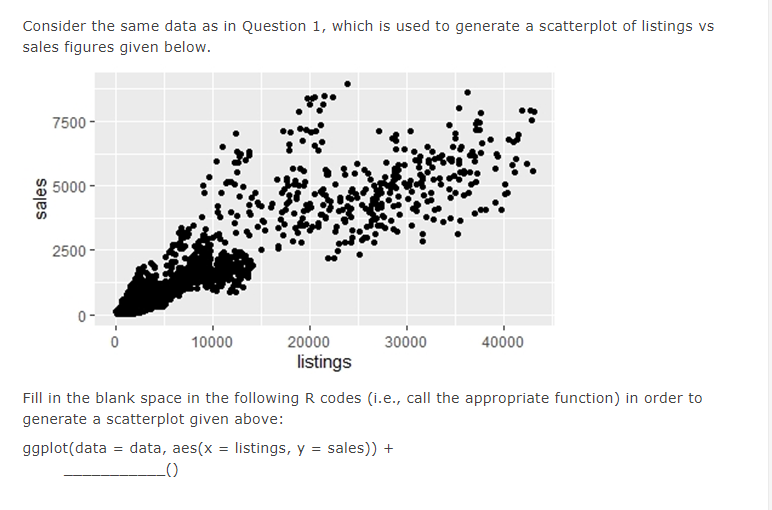
Consider the same data as in Question 1, which is used to generate a scatterplot of listings vs sales figures given below. 7500 - 5000 - sales 2500 - 0 - O 10000 20000 30000 40000 listings Fill in the blank space in the following R codes (i.e., call the appropriate function) in order to generate a scatterplot given above: ggplot(data = data, aes(x = listings, y = sales)) +
Step by Step Solution
There are 3 Steps involved in it
1 Expert Approved Answer
Step: 1 Unlock

Question Has Been Solved by an Expert!
Get step-by-step solutions from verified subject matter experts
Step: 2 Unlock
Step: 3 Unlock