

Question: Answer the following multi-part question based on the information provided a. Why are ratios useful? What three groups use ratio analysis and for what reasons?
Answer the following multi-part question based on the information provided
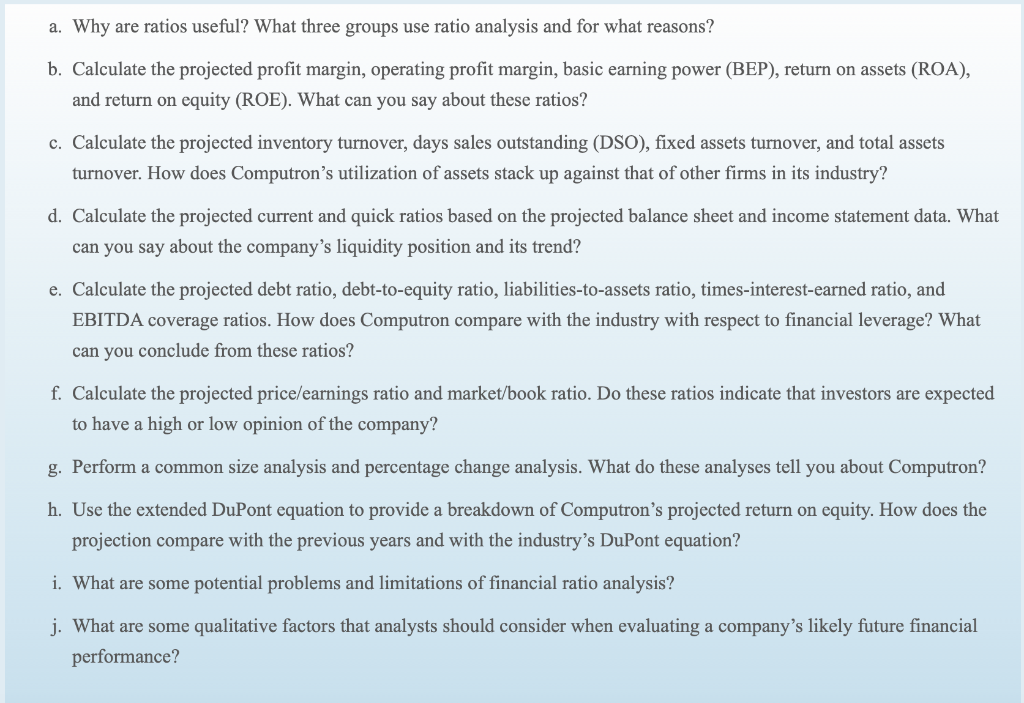
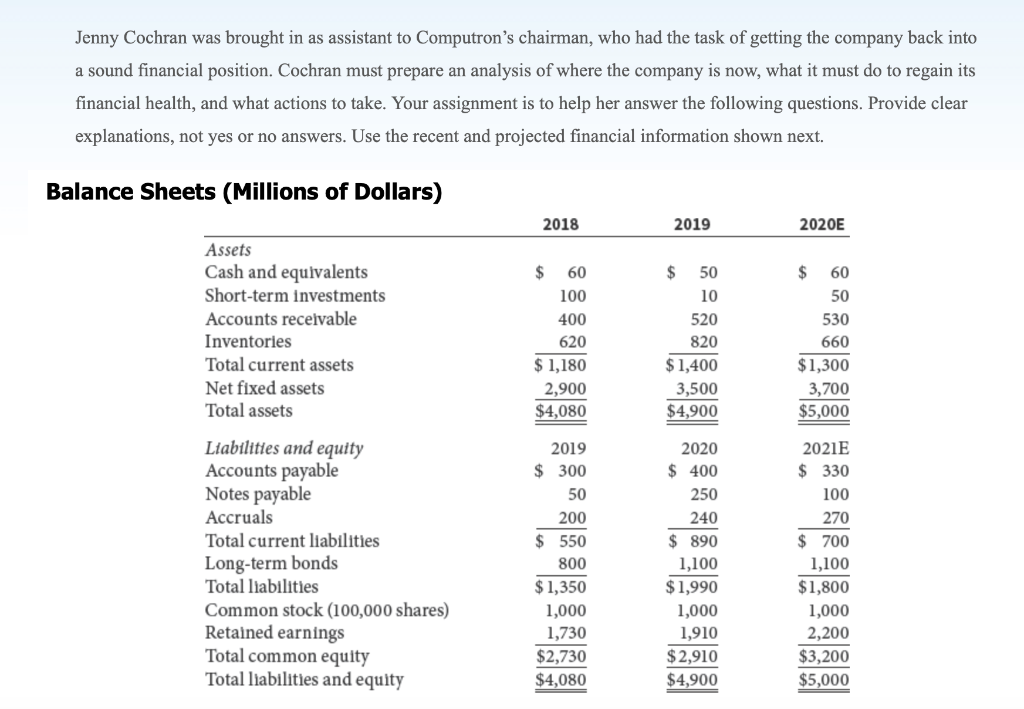
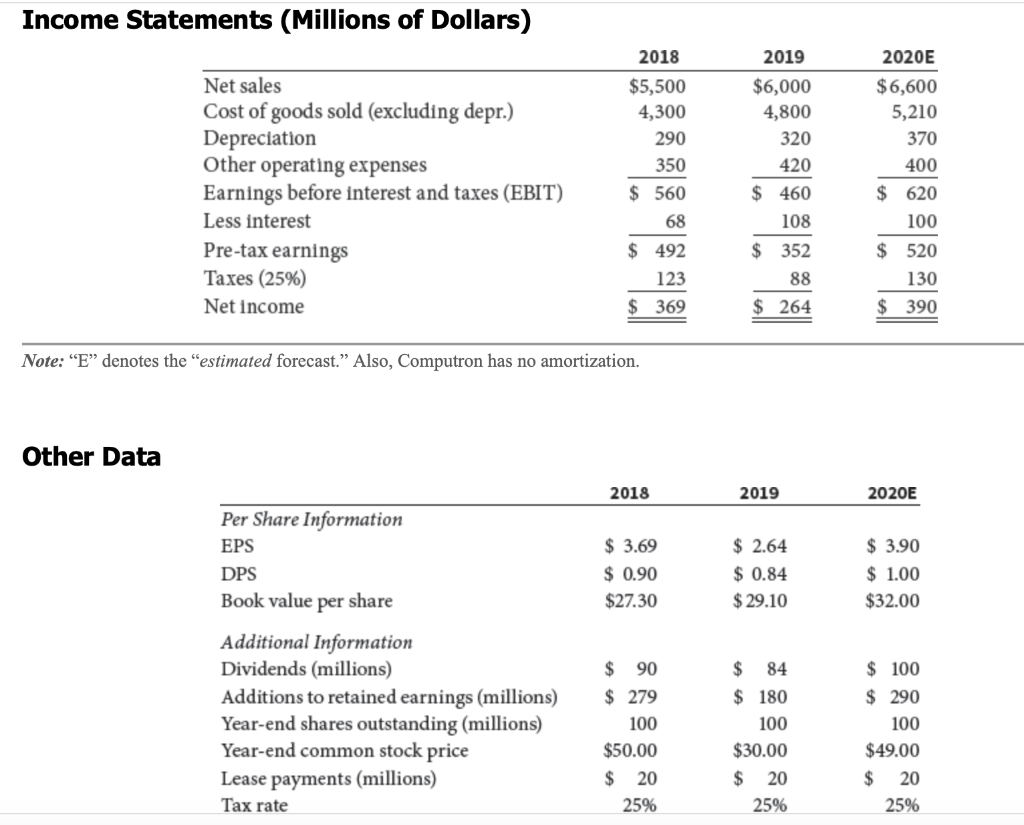
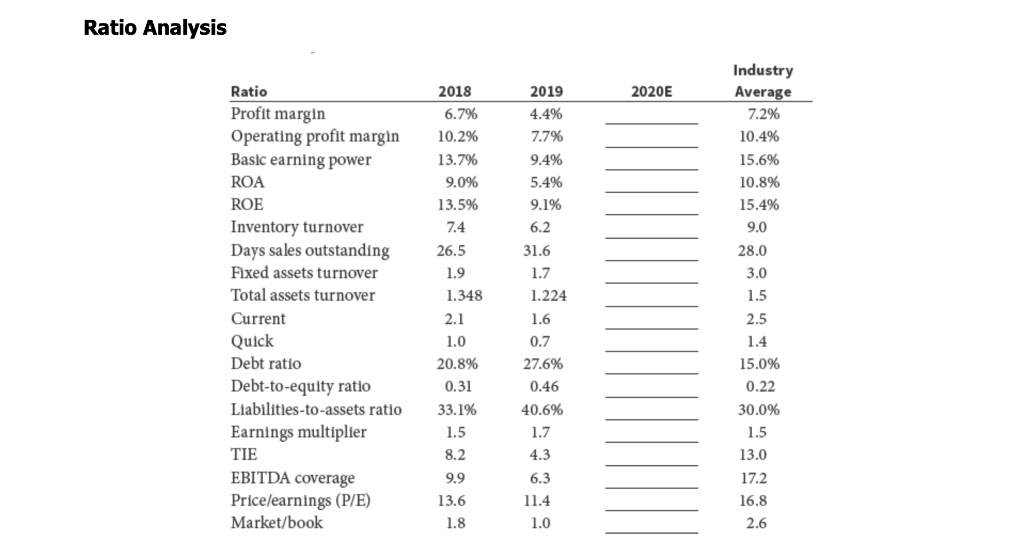
a. Why are ratios useful? What three groups use ratio analysis and for what reasons? b. Calculate the projected profit margin, operating profit margin, basic earning power (BEP), return on assets (ROA), and return on equity (ROE). What can you say about these ratios? c. Calculate the projected inventory turnover, days sales outstanding (DSO), fixed assets turnover, and total assets turnover. How does Computron's utilization of assets stack up against that of other firms in its industry? d. Calculate the projected current and quick ratios based on the projected balance sheet and income statement data. What can you say about the company's liquidity position and its trend? e. Calculate the projected debt ratio, debt-to-equity ratio, liabilities-to-assets ratio, times-interest-earned ratio, and EBITDA coverage ratios. How does Computron compare with the industry with respect to financial leverage? What can you conclude from these ratios? f. Calculate the projected price/earnings ratio and market/book ratio. Do these ratios indicate that investors are expected to have a high or low opinion of the company? g. Perform a common size analysis and percentage change analysis. What do these analyses tell you about Computron? h. Use the extended DuPont equation to provide a breakdown of Computron's projected return on equity. How does the projection compare with the previous years and with the industry's DuPont equation? i. What are some potential problems and limitations of financial ratio analysis? j. What are some qualitative factors that analysts should consider when evaluating a company's likely future financial performance? Jenny Cochran was brought in as assistant to Computron's chairman, who had the task of getting the company back into a sound financial position. Cochran must prepare an analysis of where the company is now, what it must do to regain its financial health, and what actions to take. Your assignment is to help her answer the following questions. Provide clear explanations, not yes or no answers. Use the recent and projected financial information shown next. Balance Sheets (Millions of Dollars) 2018 2019 2020E $ 60 100 Assets Cash and equivalents Short-term investments Accounts receivable Inventories Total current assets Net fixed assets Total assets 400 620 $ 1,180 2,900 $4,080 $ 50 10 520 820 $1,400 3,500 $4,900 $ 60 50 530 660 $1,300 3,700 $5,000 Liabilities and equity Accounts payable Notes payable Accruals Total current liabilities Long-term bonds Total liabilities Common stock (100,000 shares) Retained earnings Total common equity Total liabilities and equity 2019 $ 300 50 200 $ 550 800 $ 1,350 1,000 1,730 $2,730 $4,080 2020 $ 400 250 240 $ 890 1,100 $ 1,990 1,000 1,910 $2,910 $4,900 2021E $ 330 100 270 $ 700 1,100 $1,800 1,000 2,200 $3,200 $5,000 Income Statements (Millions of Dollars) Net sales Cost of goods sold (excluding depr.) Depreciation Other operating expenses Earnings before interest and taxes (EBIT) Less interest Pre-tax earnings Taxes (25%) Net income 2018 $5,500 4,300 290 350 $ 560 68 $ 492 123 2019 $6,000 4,800 320 420 $ 460 108 $ 352 88 $ 264 2020E $6,600 5,210 370 400 $ 620 100 $ 520 130 $ 369 $ 390 Note: E denotes the "estimated forecast. Also, Computron has no amortization. Other Data 2018 2019 2020E Per Share Information EPS DPS $ 3.69 $ 0.90 $27.30 $ 2.64 $ 0.84 $29.10 $ 3.90 $ 1.00 $32.00 Book value per share Additional Information Dividends (millions) Additions to retained earnings (millions) Year-end shares outstanding (millions) Year-end common stock price Lease payments (millions) Tax rate $ 100 $ 290 100 $ 90 $ 279 100 $50.00 $ 20 25% $ 84 $ 180 100 $30.00 $ 20 25% $49.00 $ 20 25% Ratio Analysis Ratio 2020E Profit margin Operating profit margin Basic earning power ROA ROE Inventory turnover Days sales outstanding Fixed assets turnover Total assets turnover Current Quick Debt ratio Debt-to-equity ratio Liabilities-to-assets ratio Earnings multiplier TIE EBITDA coverage Price/earnings (P/E) Market/book 2018 6.7% 10.2% 13.7% 9.0% 13.5% 7.4 26.5 1.9 1.348 2.1 1.0 20.8% 0.31 33.1% 1.5 8.2 9.9 13.6 1.8 2019 4.4% 7.7% 9.4% 5.4% 9.1% 6.2 31.6 1.7 1.224 1.6 0.7 27.6% 0.46 40.6% 1.7 4.3 6.3 11.4 1.0 Industry Average 7.2% 10.4% 15.6% 10.8% 15.4% 9.0 28.0 3.0 1.5 2.5 1.4 15.0% 0.22 30.0% 1.5 13.0 17.2 0.7 16.8 2.6 a. Why are ratios useful? What three groups use ratio analysis and for what reasons? b. Calculate the projected profit margin, operating profit margin, basic earning power (BEP), return on assets (ROA), and return on equity (ROE). What can you say about these ratios? c. Calculate the projected inventory turnover, days sales outstanding (DSO), fixed assets turnover, and total assets turnover. How does Computron's utilization of assets stack up against that of other firms in its industry? d. Calculate the projected current and quick ratios based on the projected balance sheet and income statement data. What can you say about the company's liquidity position and its trend? e. Calculate the projected debt ratio, debt-to-equity ratio, liabilities-to-assets ratio, times-interest-earned ratio, and EBITDA coverage ratios. How does Computron compare with the industry with respect to financial leverage? What can you conclude from these ratios? f. Calculate the projected price/earnings ratio and market/book ratio. Do these ratios indicate that investors are expected to have a high or low opinion of the company? g. Perform a common size analysis and percentage change analysis. What do these analyses tell you about Computron? h. Use the extended DuPont equation to provide a breakdown of Computron's projected return on equity. How does the projection compare with the previous years and with the industry's DuPont equation? i. What are some potential problems and limitations of financial ratio analysis? j. What are some qualitative factors that analysts should consider when evaluating a company's likely future financial performance? Jenny Cochran was brought in as assistant to Computron's chairman, who had the task of getting the company back into a sound financial position. Cochran must prepare an analysis of where the company is now, what it must do to regain its financial health, and what actions to take. Your assignment is to help her answer the following questions. Provide clear explanations, not yes or no answers. Use the recent and projected financial information shown next. Balance Sheets (Millions of Dollars) 2018 2019 2020E $ 60 100 Assets Cash and equivalents Short-term investments Accounts receivable Inventories Total current assets Net fixed assets Total assets 400 620 $ 1,180 2,900 $4,080 $ 50 10 520 820 $1,400 3,500 $4,900 $ 60 50 530 660 $1,300 3,700 $5,000 Liabilities and equity Accounts payable Notes payable Accruals Total current liabilities Long-term bonds Total liabilities Common stock (100,000 shares) Retained earnings Total common equity Total liabilities and equity 2019 $ 300 50 200 $ 550 800 $ 1,350 1,000 1,730 $2,730 $4,080 2020 $ 400 250 240 $ 890 1,100 $ 1,990 1,000 1,910 $2,910 $4,900 2021E $ 330 100 270 $ 700 1,100 $1,800 1,000 2,200 $3,200 $5,000 Income Statements (Millions of Dollars) Net sales Cost of goods sold (excluding depr.) Depreciation Other operating expenses Earnings before interest and taxes (EBIT) Less interest Pre-tax earnings Taxes (25%) Net income 2018 $5,500 4,300 290 350 $ 560 68 $ 492 123 2019 $6,000 4,800 320 420 $ 460 108 $ 352 88 $ 264 2020E $6,600 5,210 370 400 $ 620 100 $ 520 130 $ 369 $ 390 Note: E denotes the "estimated forecast. Also, Computron has no amortization. Other Data 2018 2019 2020E Per Share Information EPS DPS $ 3.69 $ 0.90 $27.30 $ 2.64 $ 0.84 $29.10 $ 3.90 $ 1.00 $32.00 Book value per share Additional Information Dividends (millions) Additions to retained earnings (millions) Year-end shares outstanding (millions) Year-end common stock price Lease payments (millions) Tax rate $ 100 $ 290 100 $ 90 $ 279 100 $50.00 $ 20 25% $ 84 $ 180 100 $30.00 $ 20 25% $49.00 $ 20 25% Ratio Analysis Ratio 2020E Profit margin Operating profit margin Basic earning power ROA ROE Inventory turnover Days sales outstanding Fixed assets turnover Total assets turnover Current Quick Debt ratio Debt-to-equity ratio Liabilities-to-assets ratio Earnings multiplier TIE EBITDA coverage Price/earnings (P/E) Market/book 2018 6.7% 10.2% 13.7% 9.0% 13.5% 7.4 26.5 1.9 1.348 2.1 1.0 20.8% 0.31 33.1% 1.5 8.2 9.9 13.6 1.8 2019 4.4% 7.7% 9.4% 5.4% 9.1% 6.2 31.6 1.7 1.224 1.6 0.7 27.6% 0.46 40.6% 1.7 4.3 6.3 11.4 1.0 Industry Average 7.2% 10.4% 15.6% 10.8% 15.4% 9.0 28.0 3.0 1.5 2.5 1.4 15.0% 0.22 30.0% 1.5 13.0 17.2 0.7 16.8 2.6
Step by Step Solution
There are 3 Steps involved in it

Get step-by-step solutions from verified subject matter experts