

Question: Answer the following multiple-choice problem: An ornithologist measures the number of eggs laid per year by two species of thrush in two different habitats. Plotting
Answer the following multiple-choice problem:
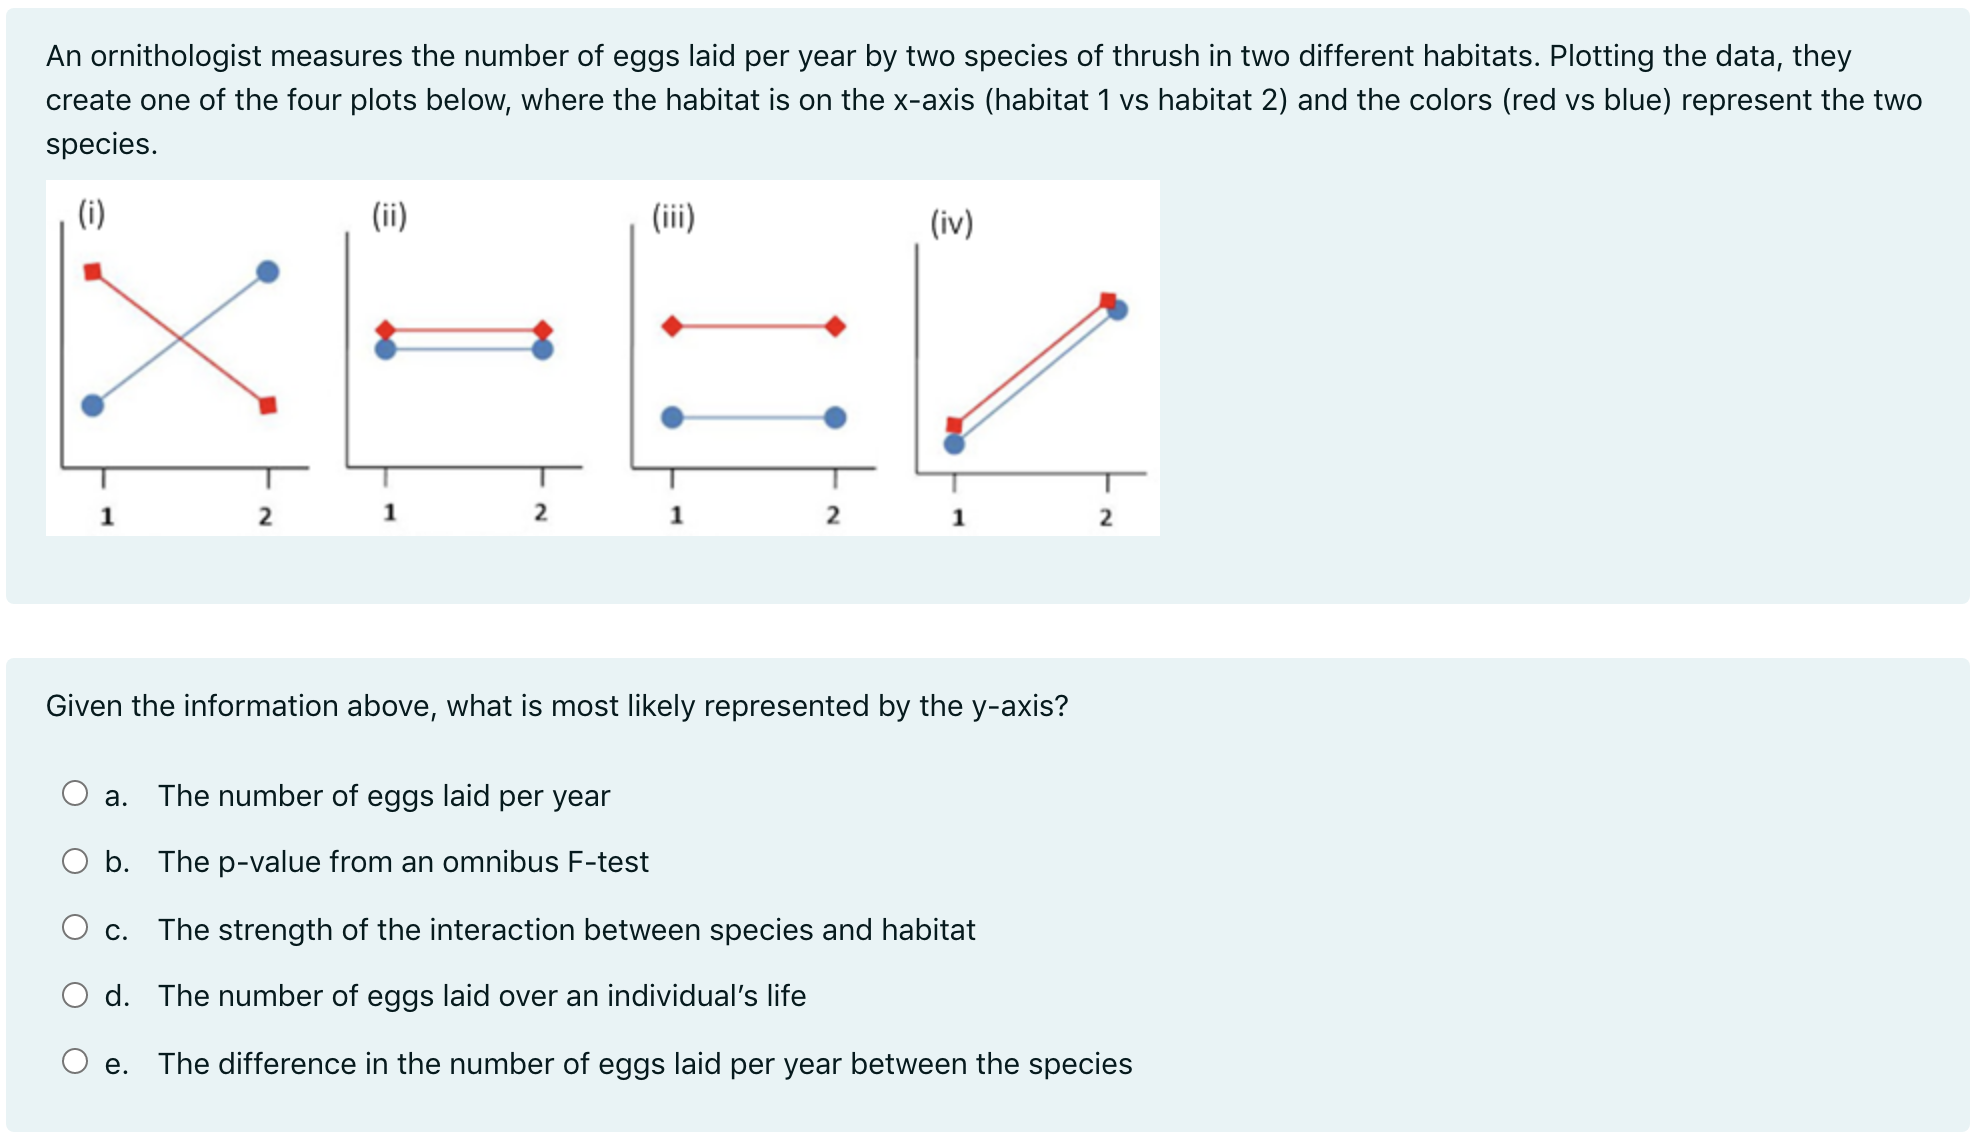
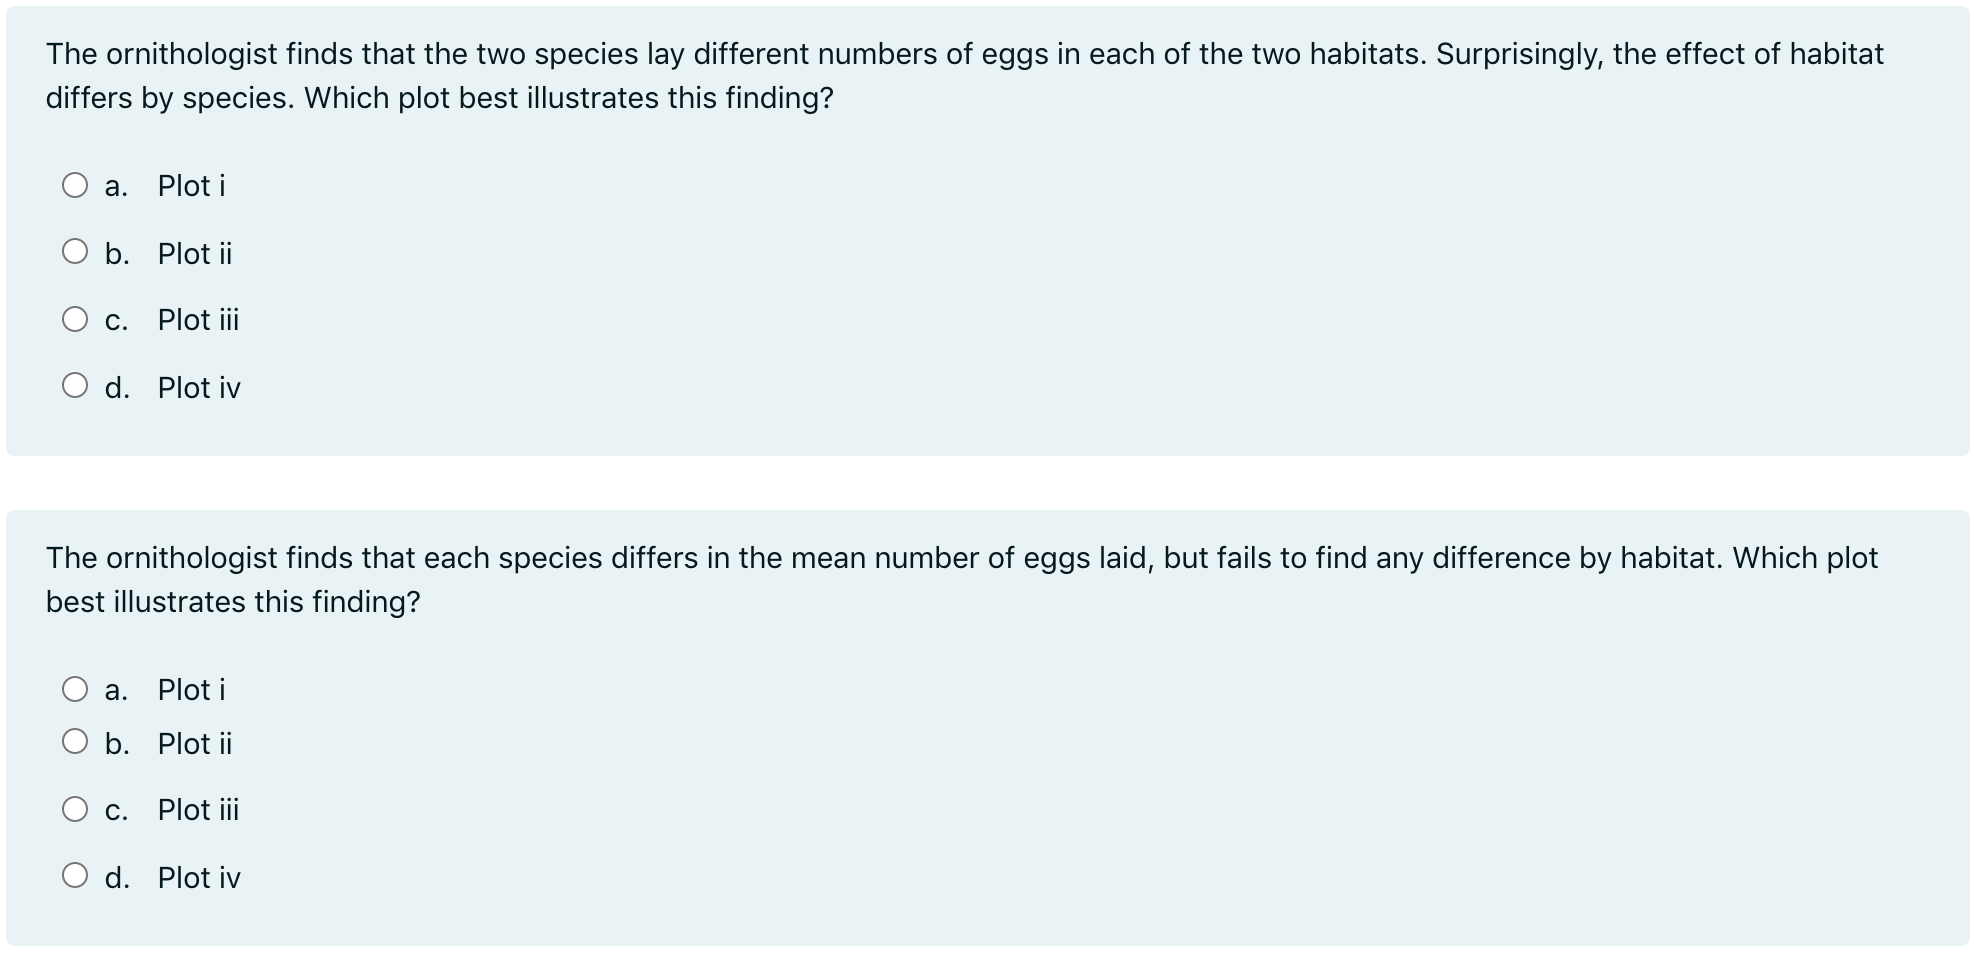
An ornithologist measures the number of eggs laid per year by two species of thrush in two different habitats. Plotting the data, they create one of the four plots below, where the habitat is on the xaxis (habitat 1 vs habitat 2) and the colors (red vs blue) represent the two species. 0) (ii) (iii) (iv) :' 90 0. 1 2 1 2 1 2 1 2 Given the information above, what is most likely represented by the y-axis? O a. The number of eggs laid per year 0 b. The pvalue from an omnibus Ftest O c. The strength of the interaction between species and habitat 0 d. The number of eggs laid over an individual's life 0 e. The difference in the number of eggs laid per year between the species The ornithologist finds that the two species lay different numbers of eggs in each of the two habitats. Surprisingly, the effect of habitat differs by species. Which plot best illustrates this finding? 0 a. Ploti O b. Plot ii 0 c. Plot iii 0 d. Plot iv The ornithologist finds that each species differs in the mean number of eggs laid, but fails to find any difference by habitat. Which plot best illustrates this finding? 0 a. Ploti O b. Plot ii 0 C. Plot iii 0 d. Plot iv
Step by Step Solution
There are 3 Steps involved in it

Get step-by-step solutions from verified subject matter experts