

Question: Answer the following question and write down the explanation how the answer was found. Question 1 (1 point) Household expenditure (thousands of dollars per year)


Answer the following question and write down the explanation how the answer was found.
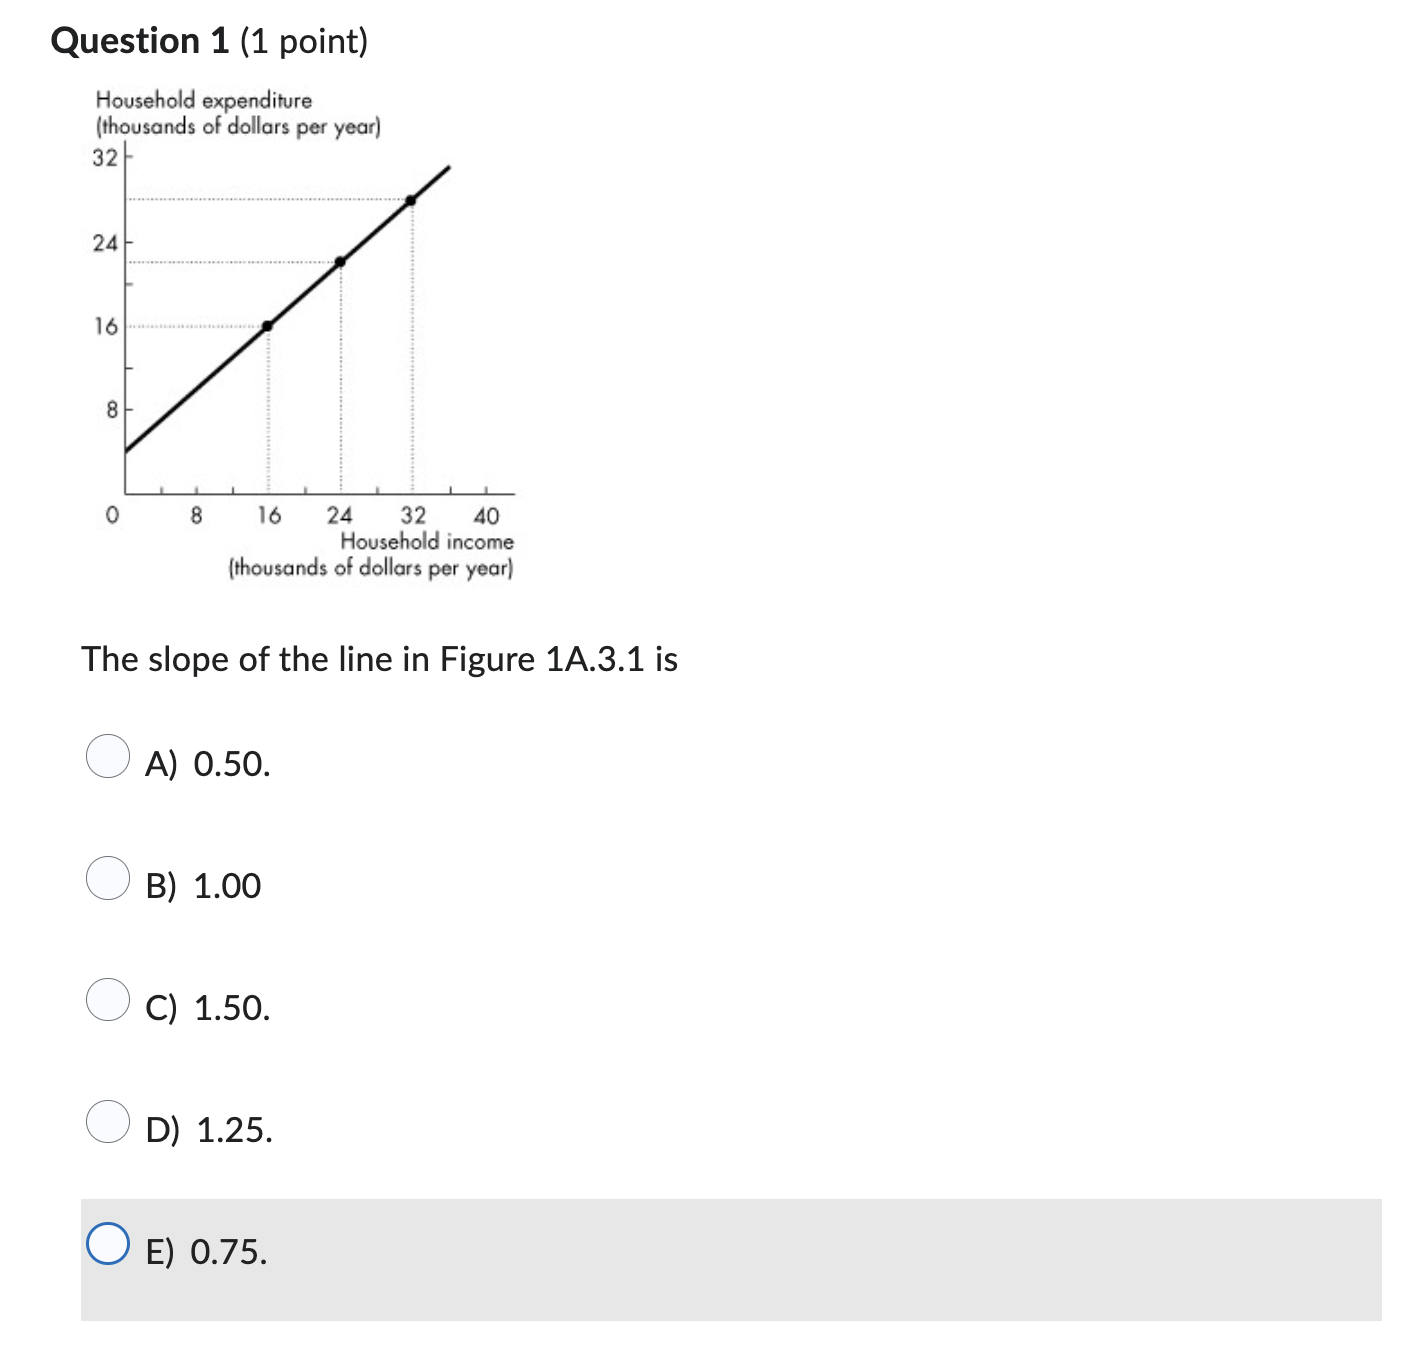
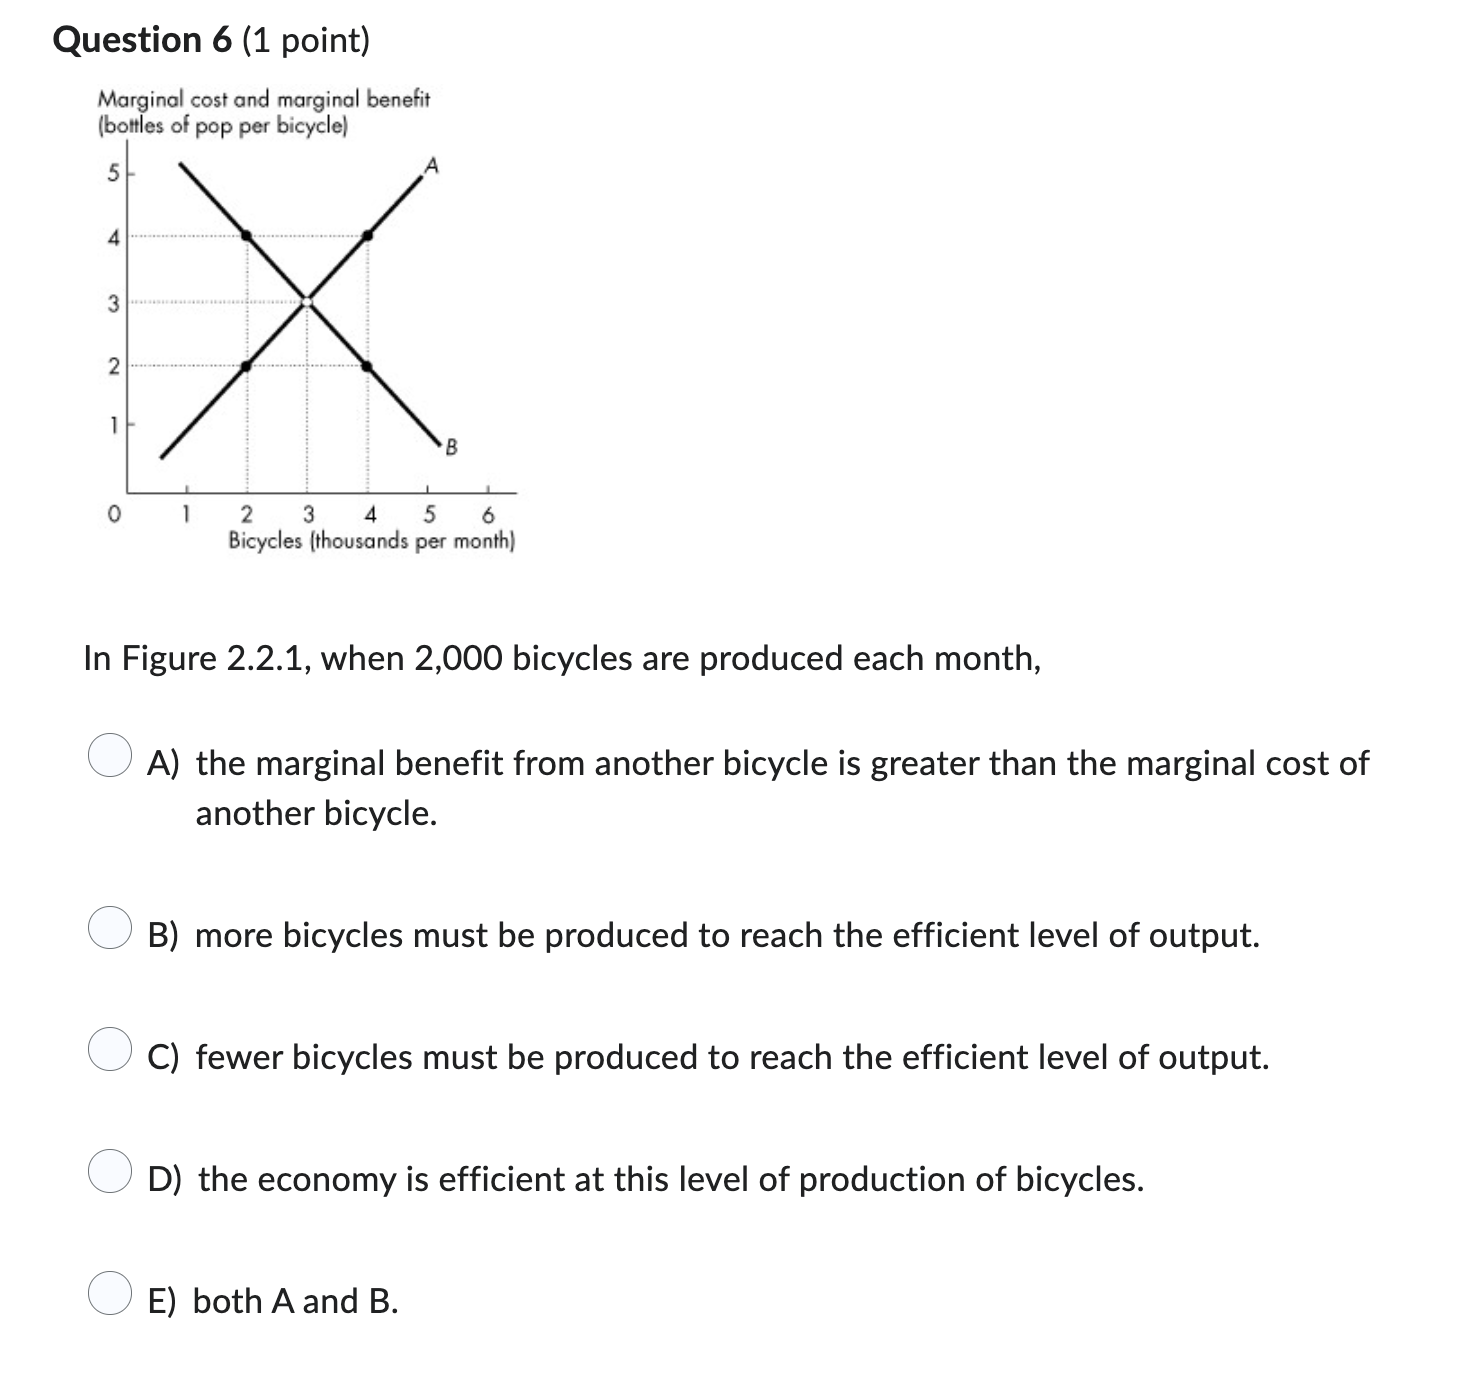
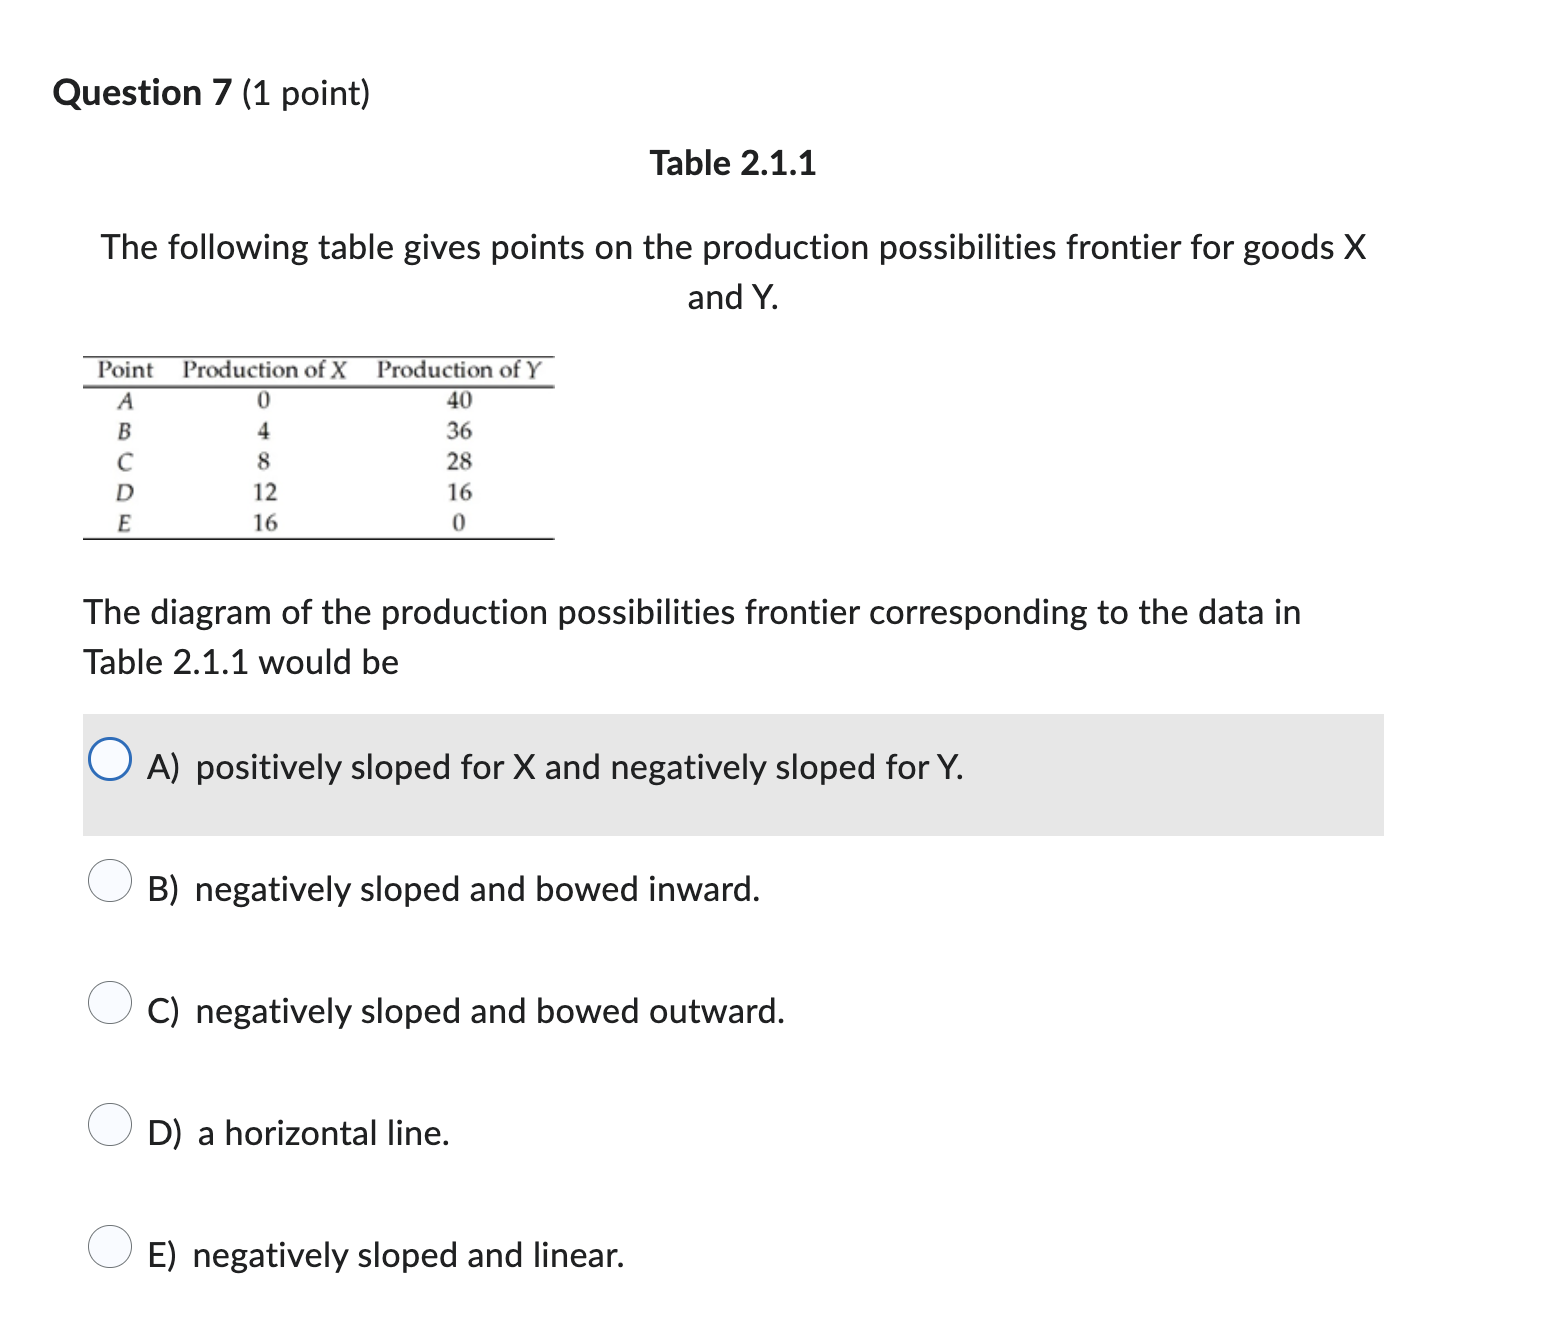


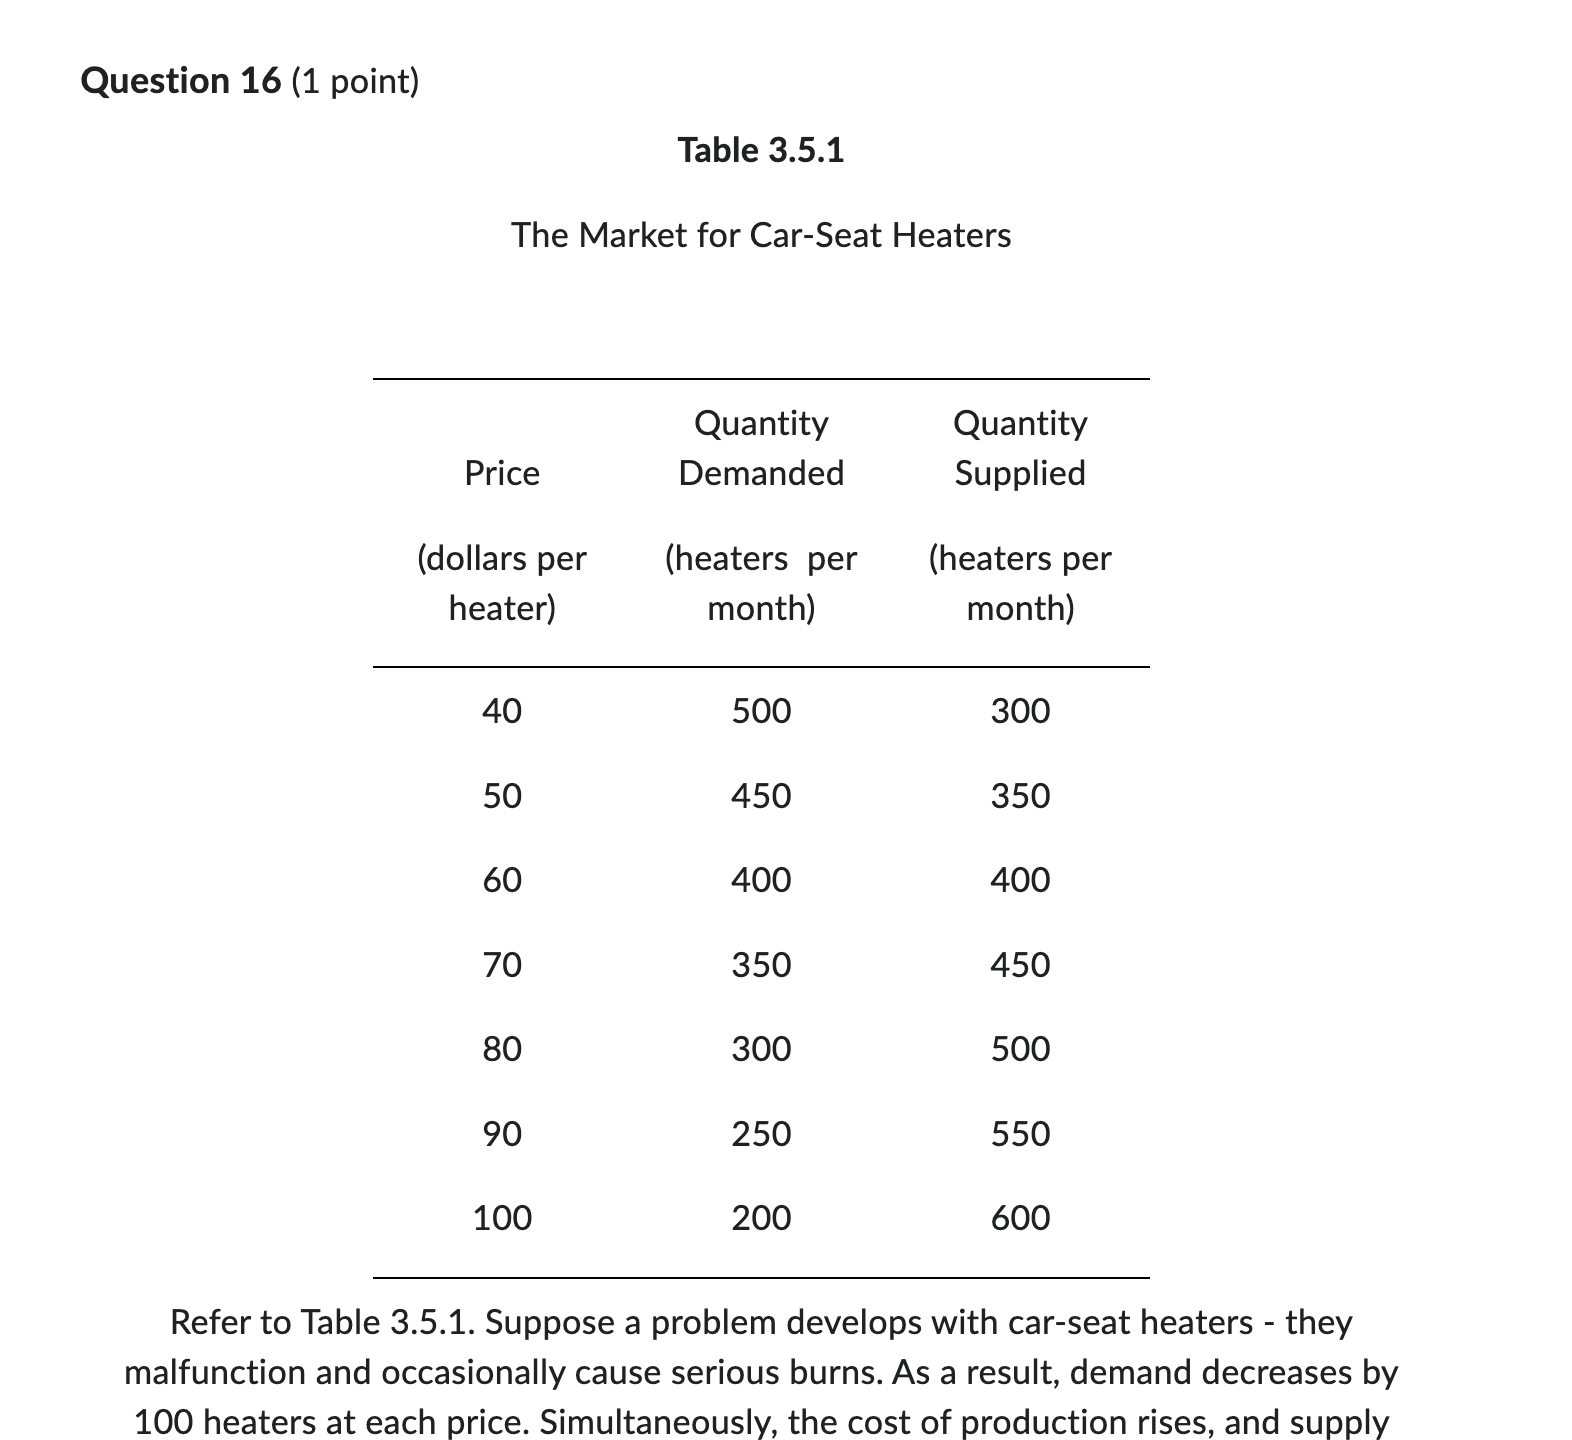
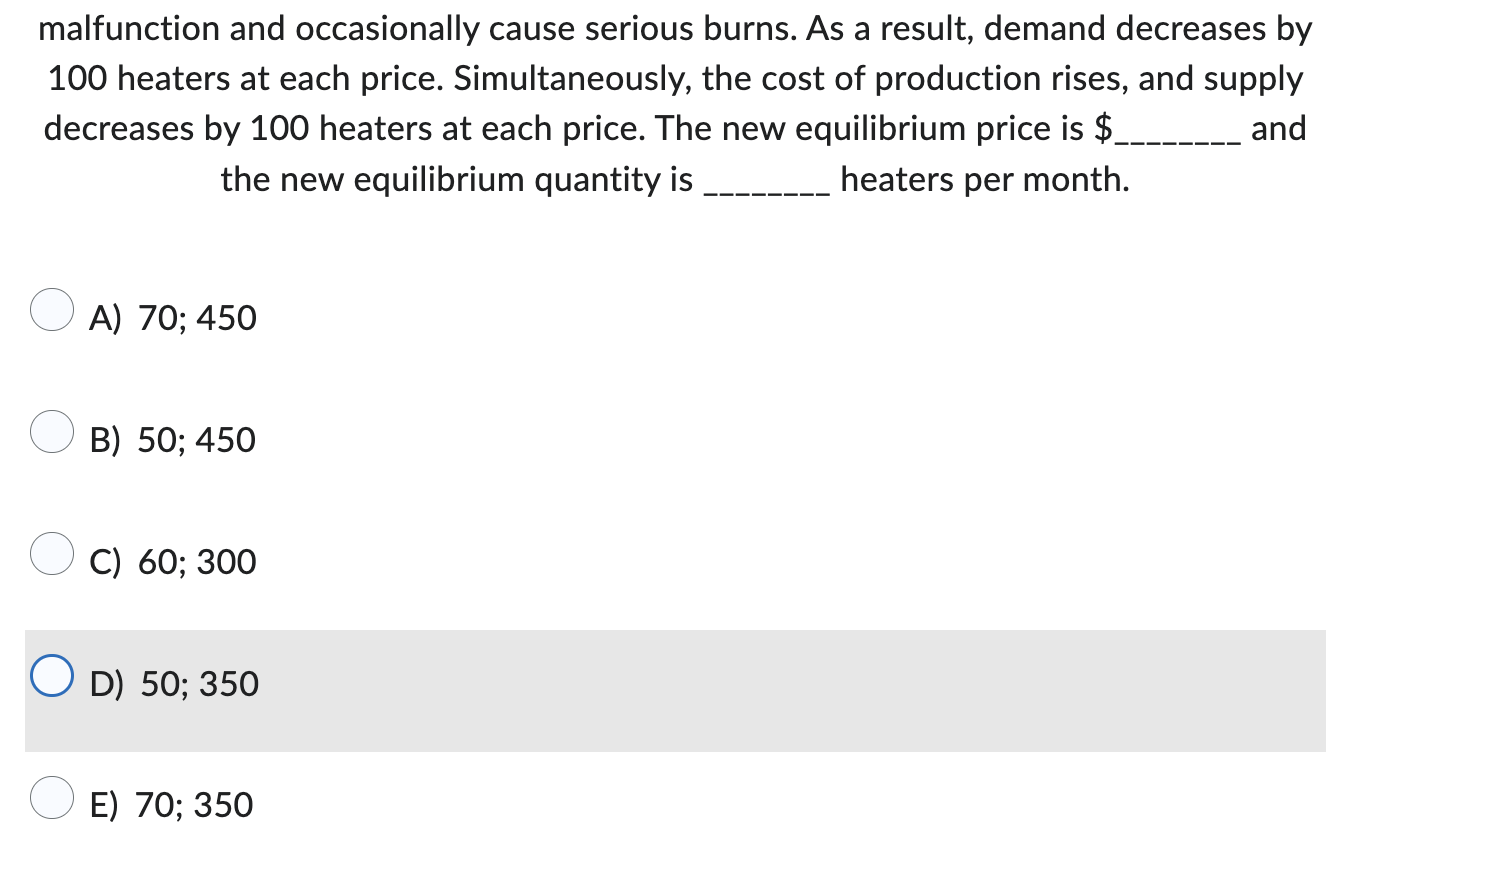
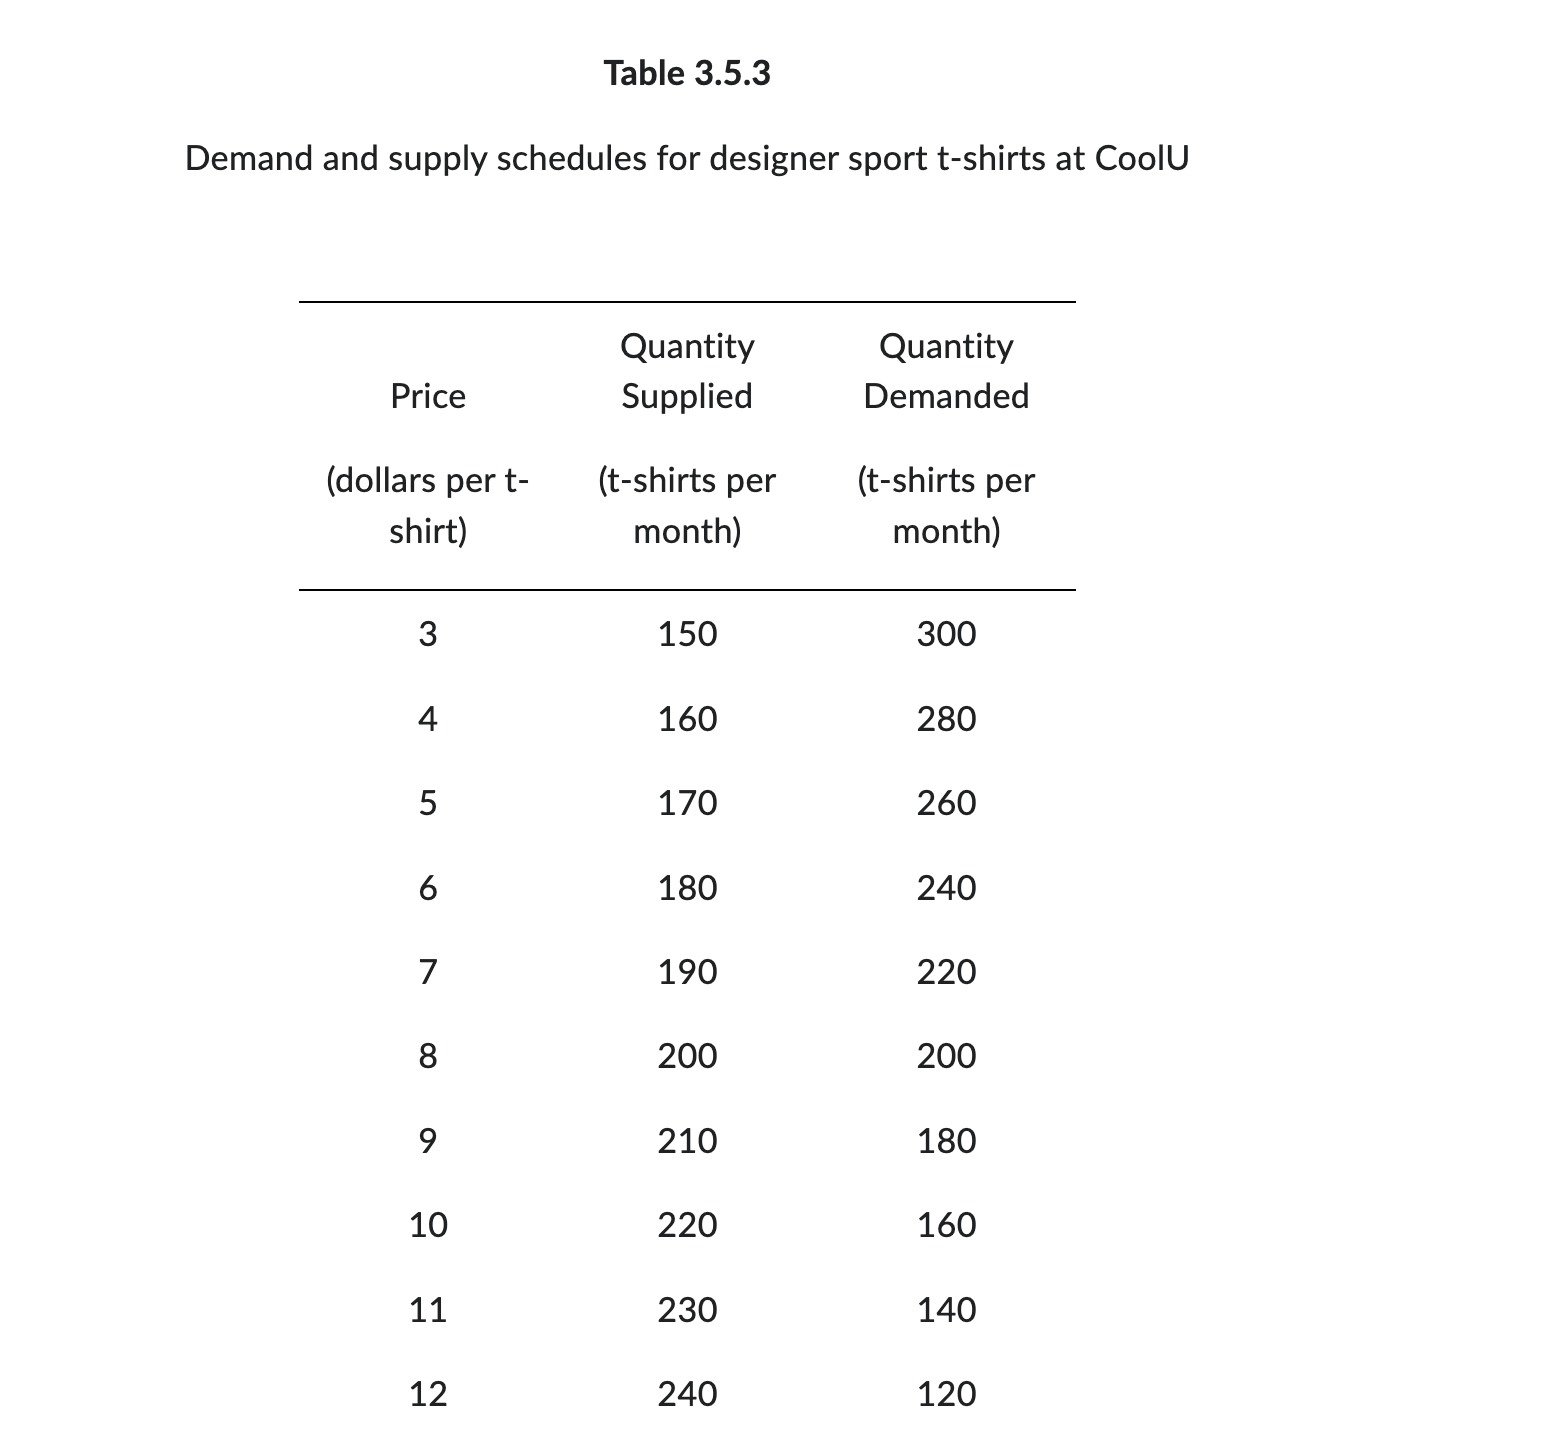

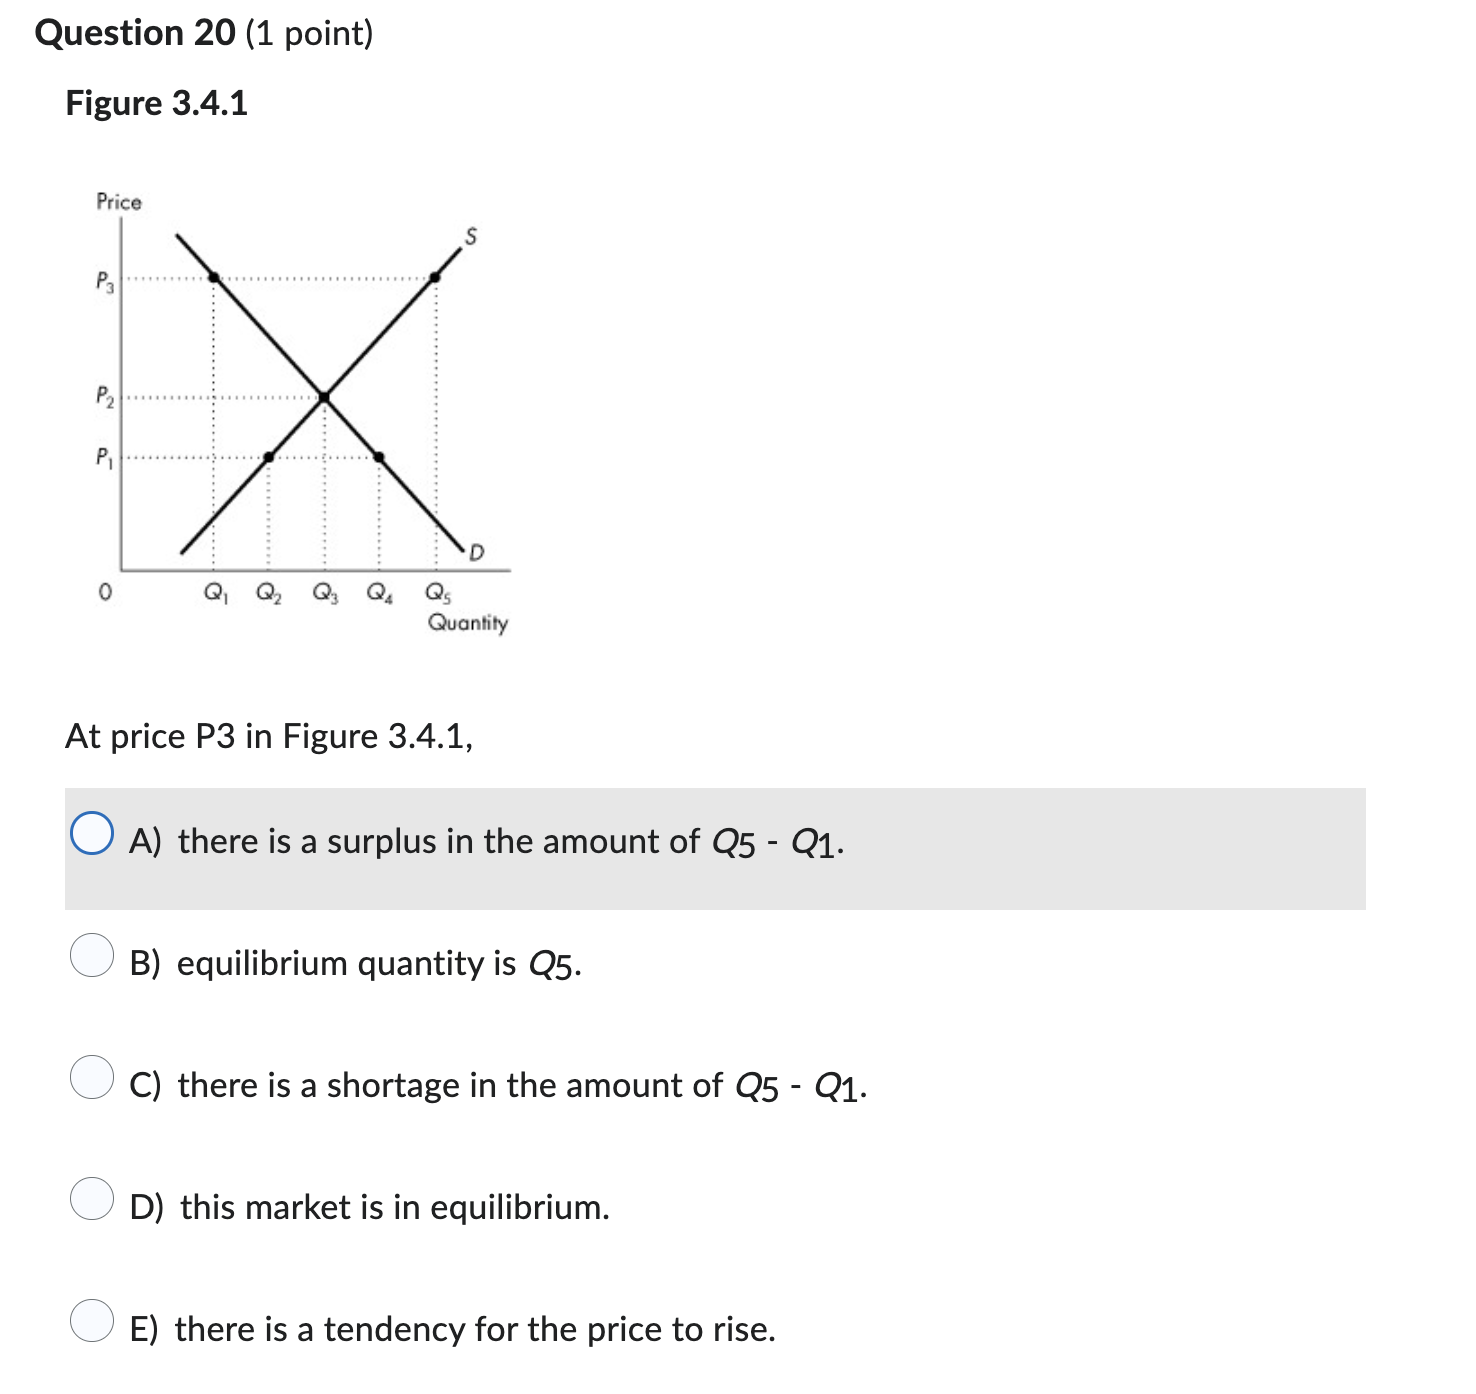

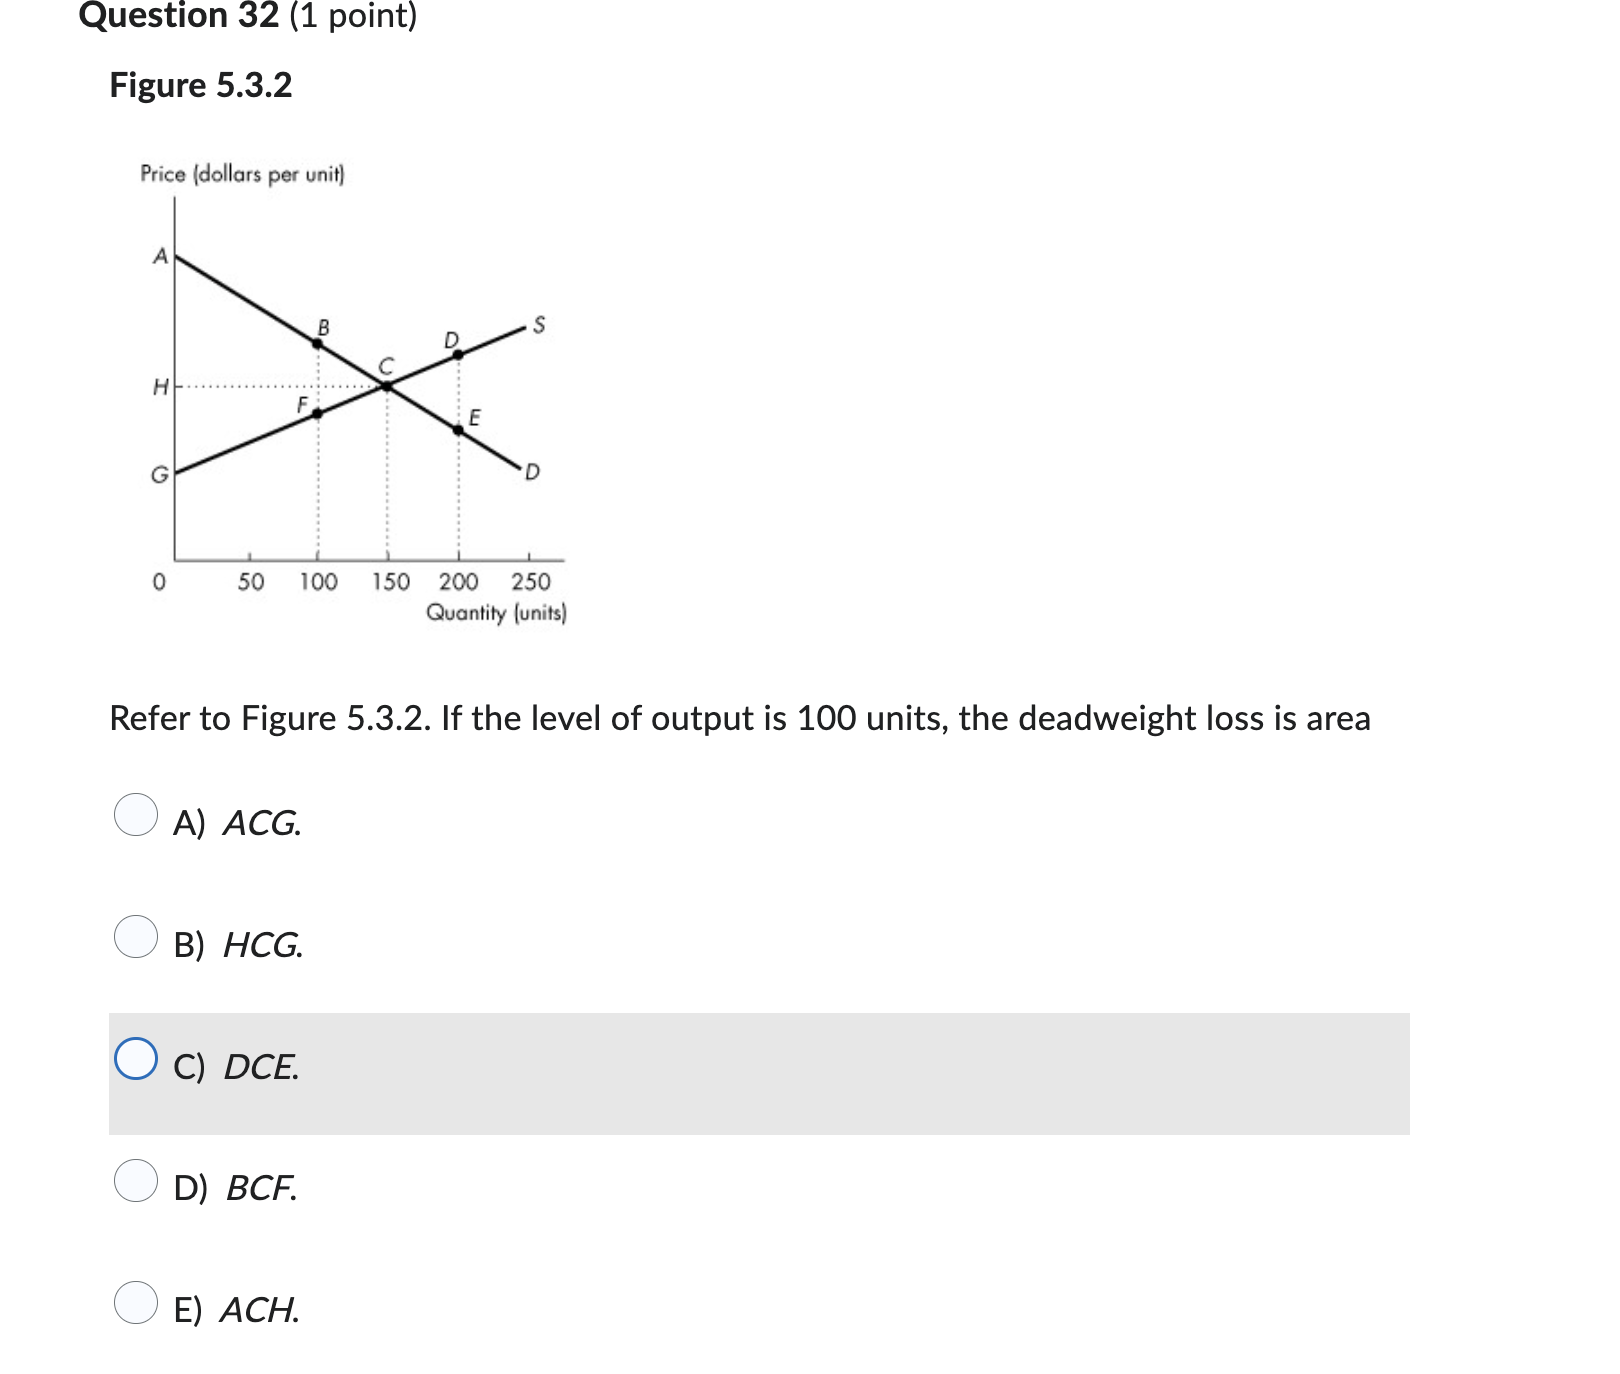


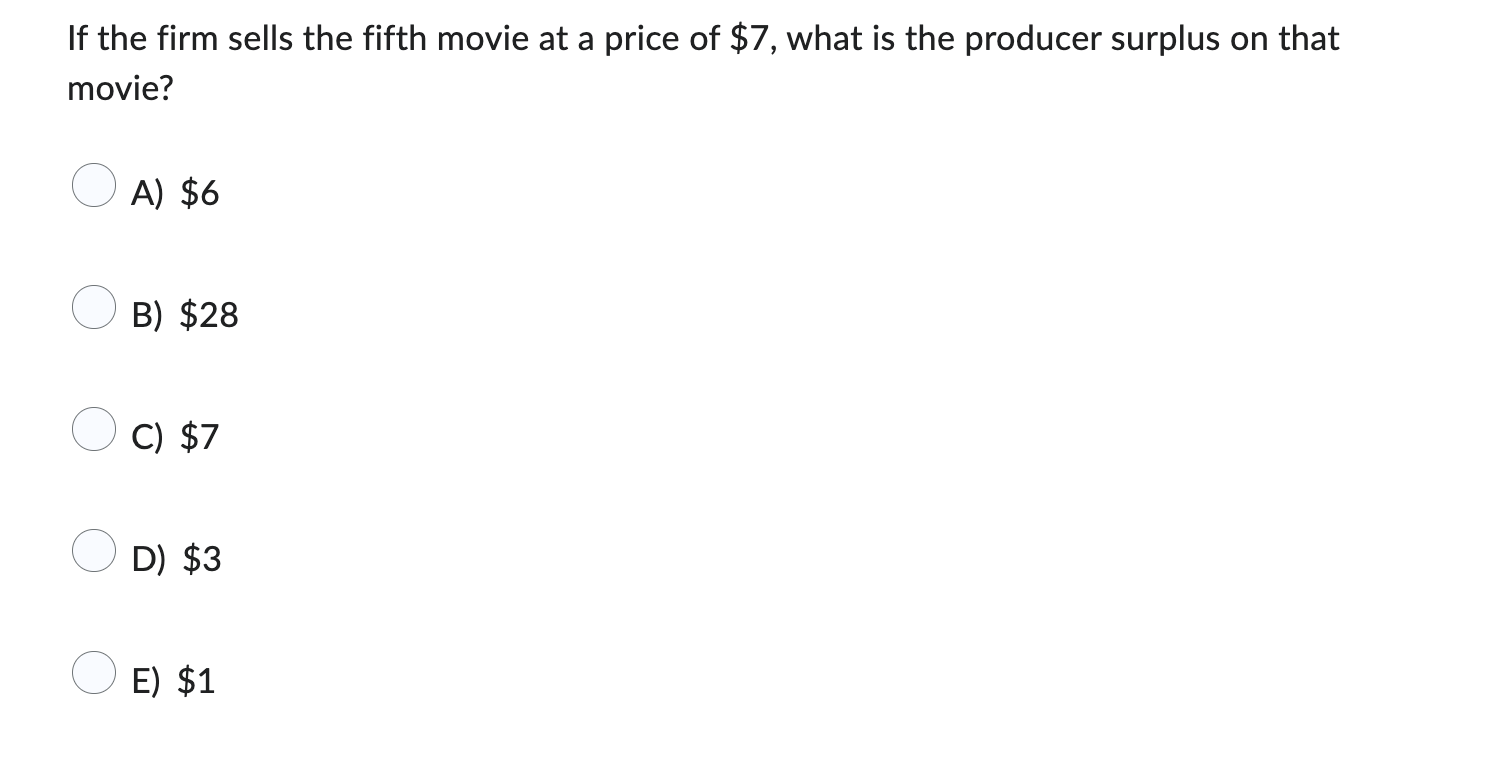


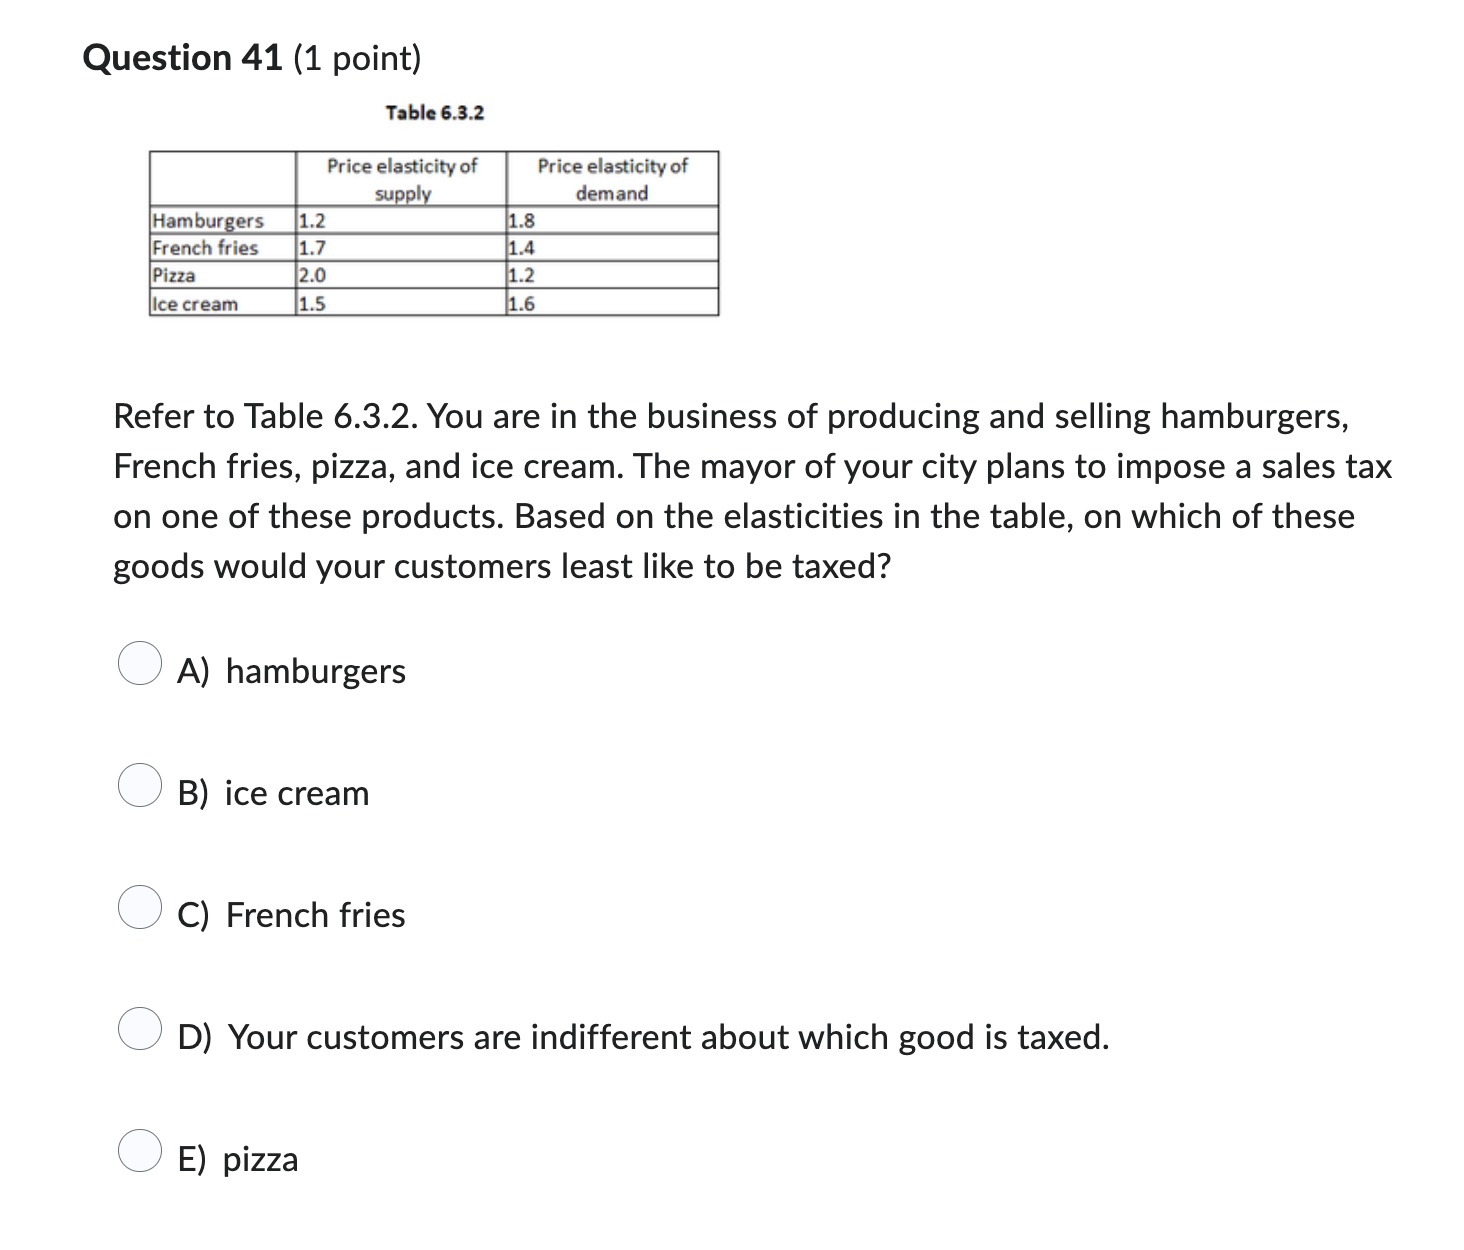


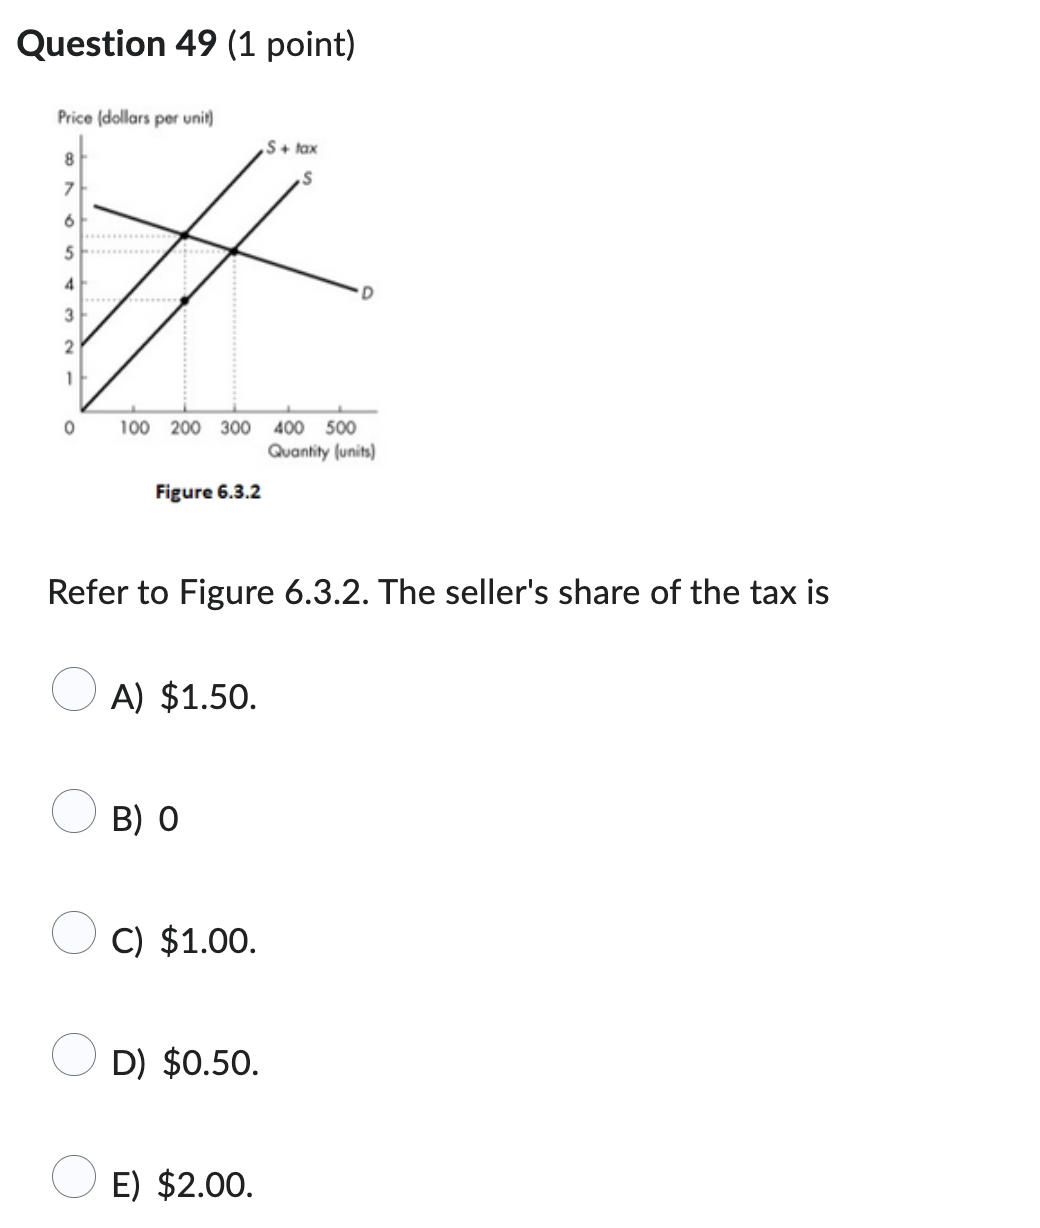
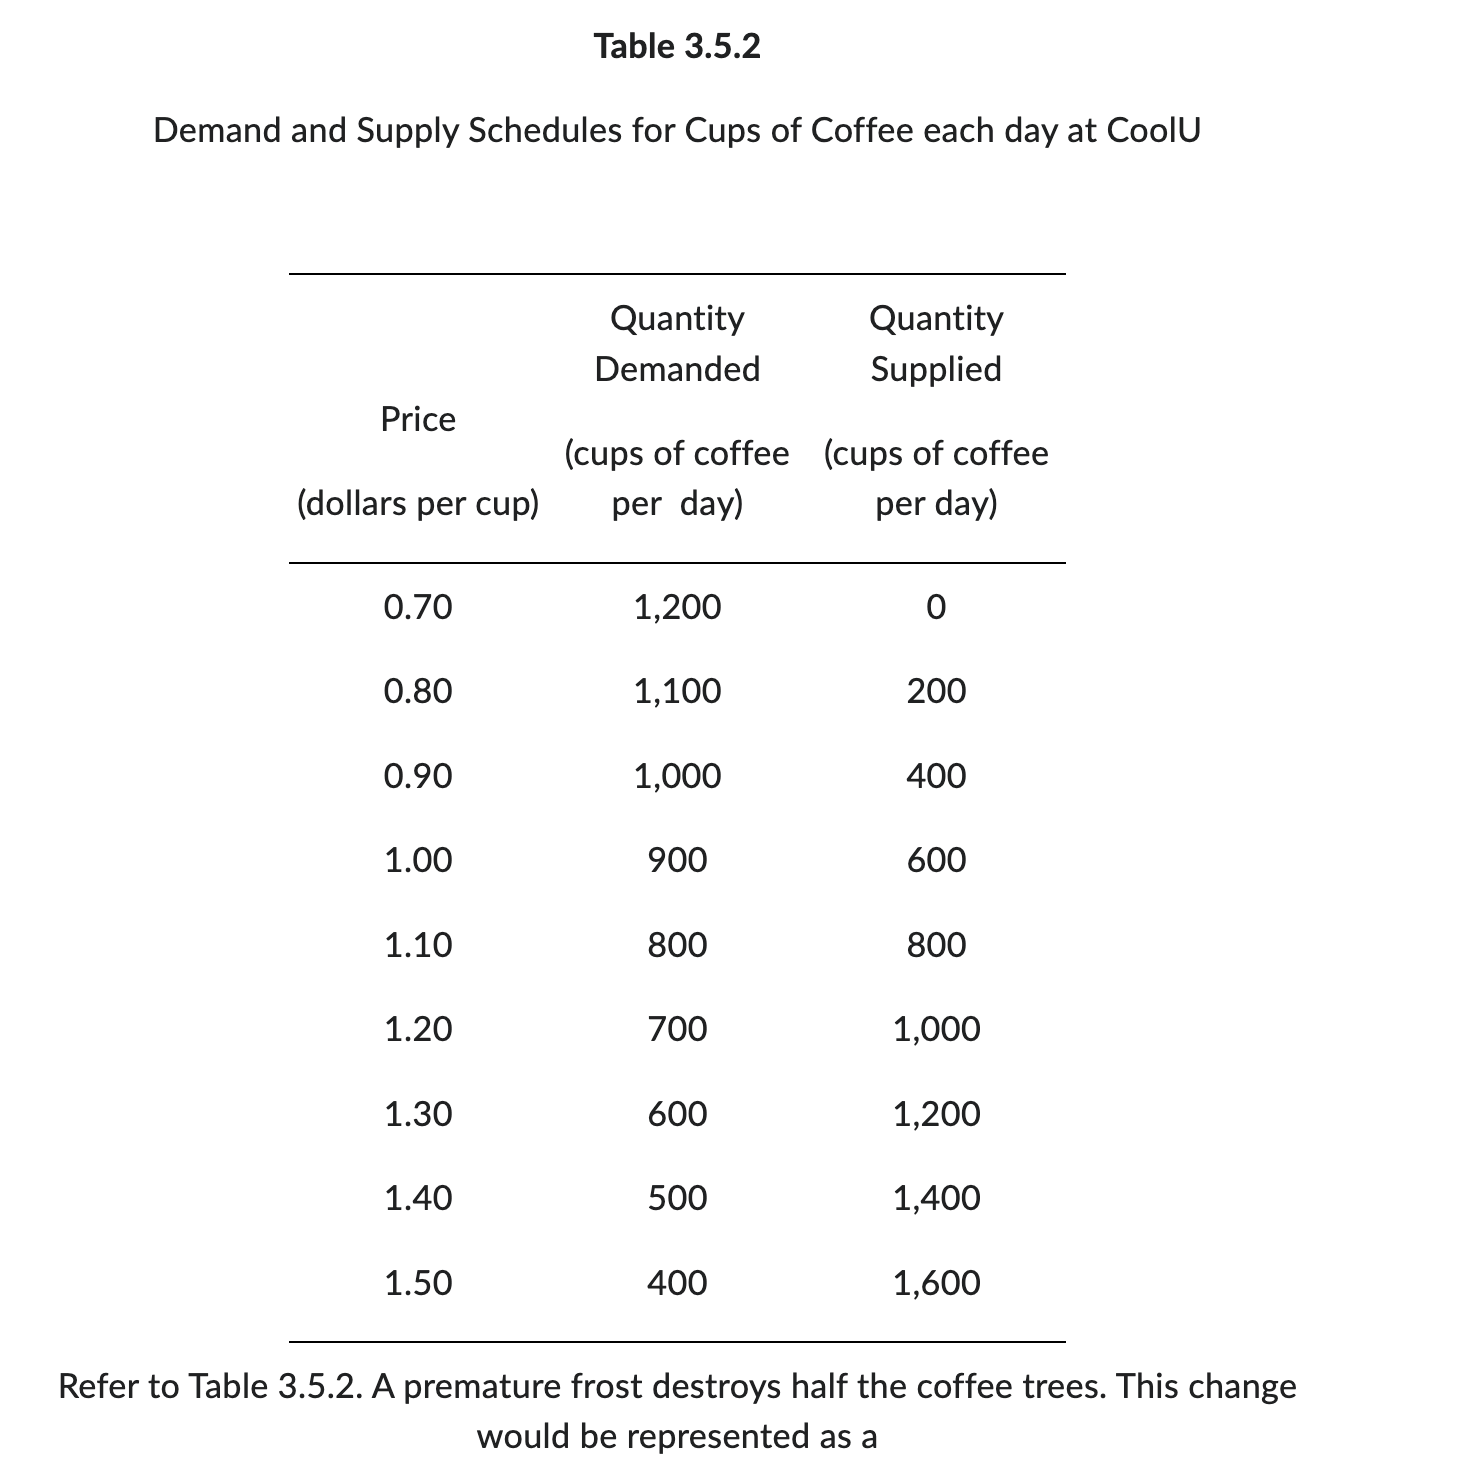
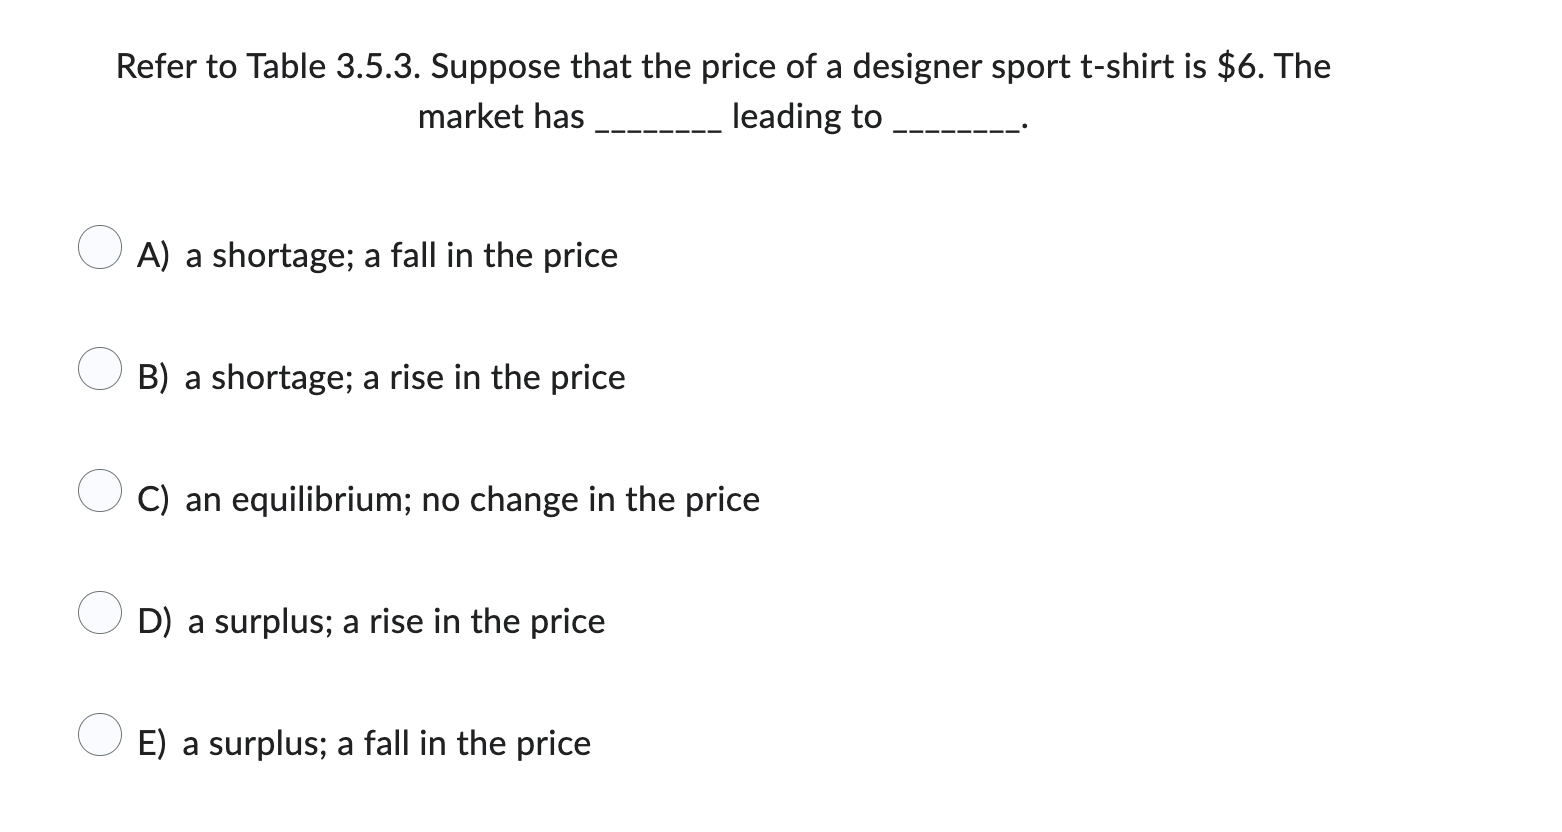
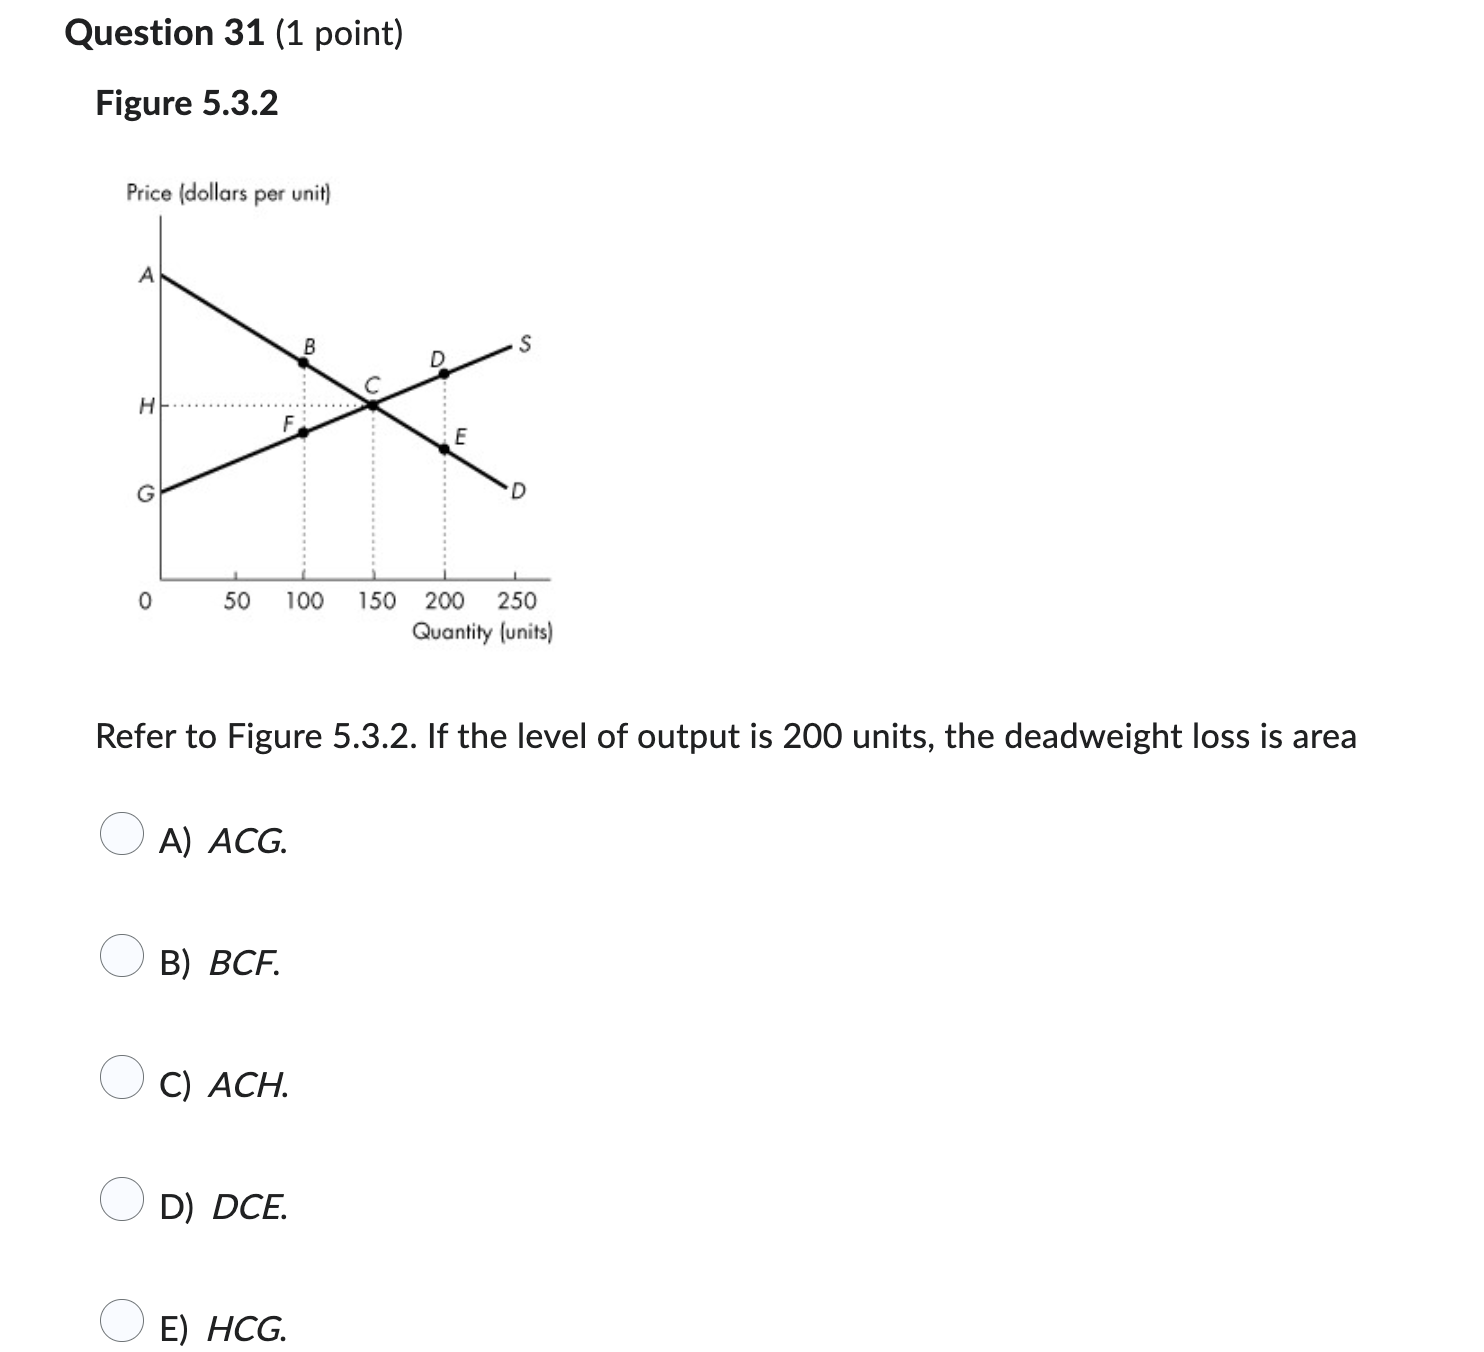
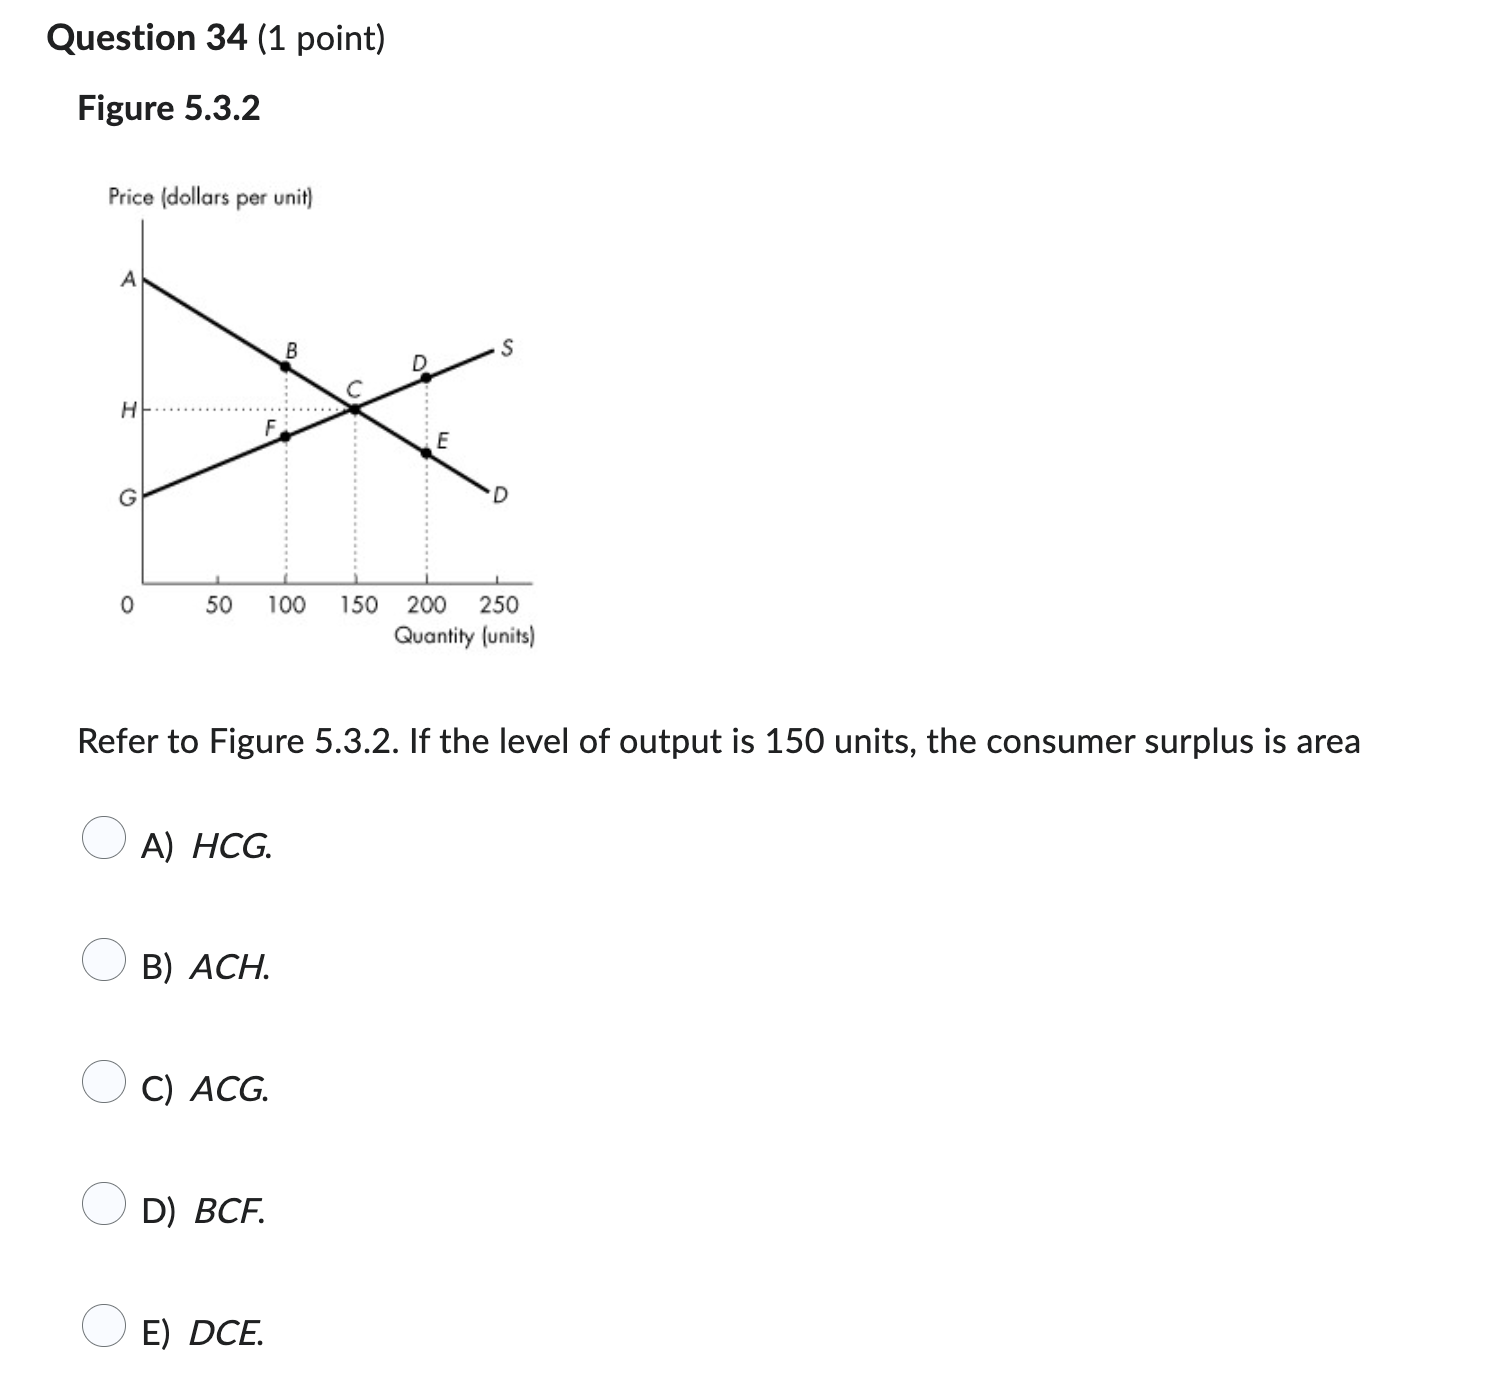
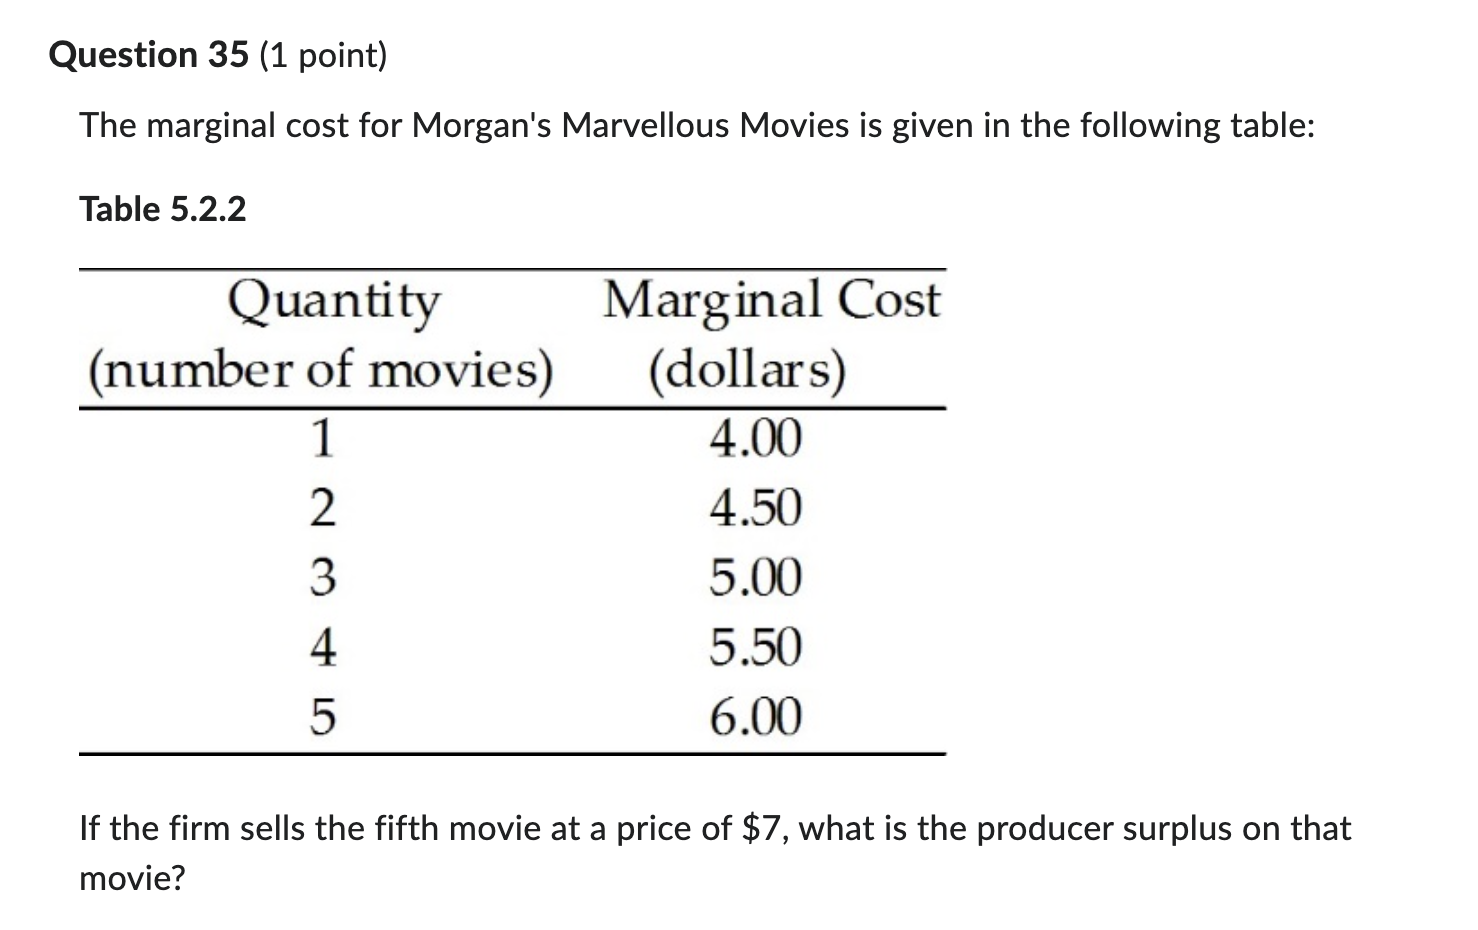
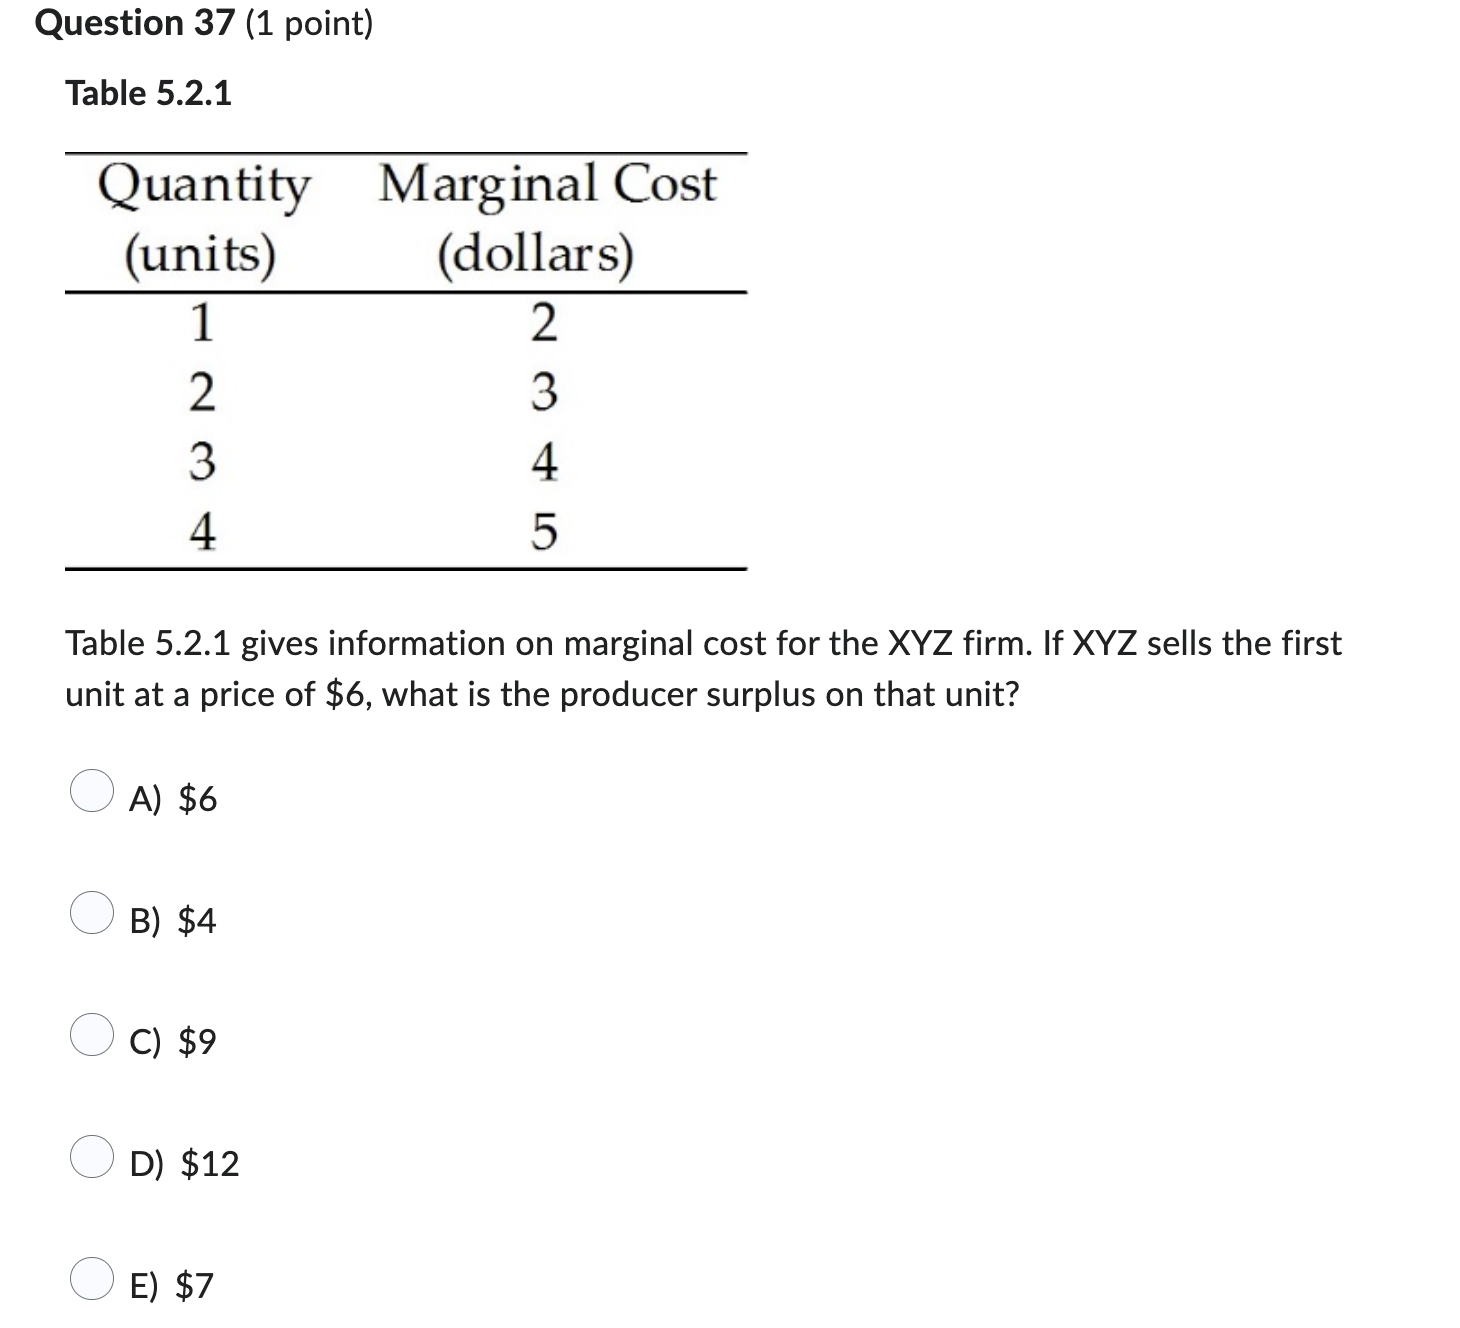
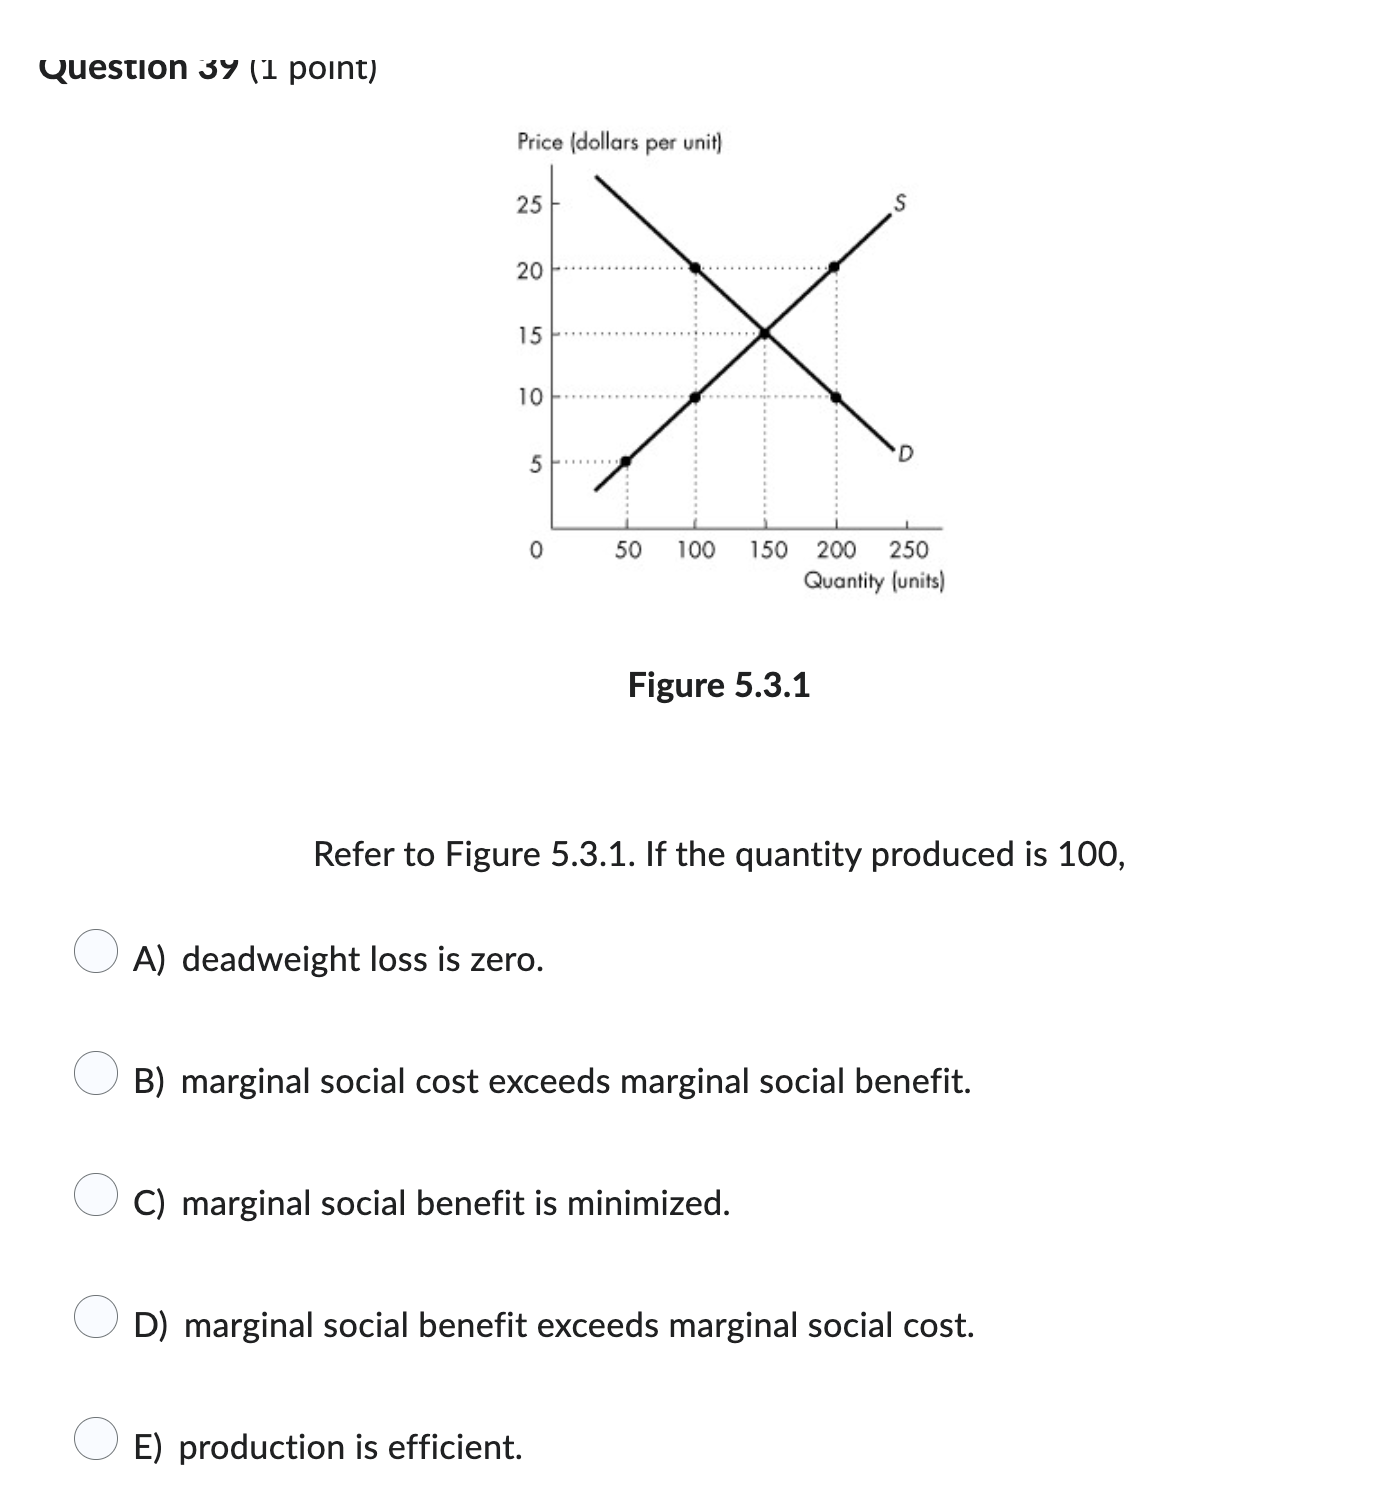
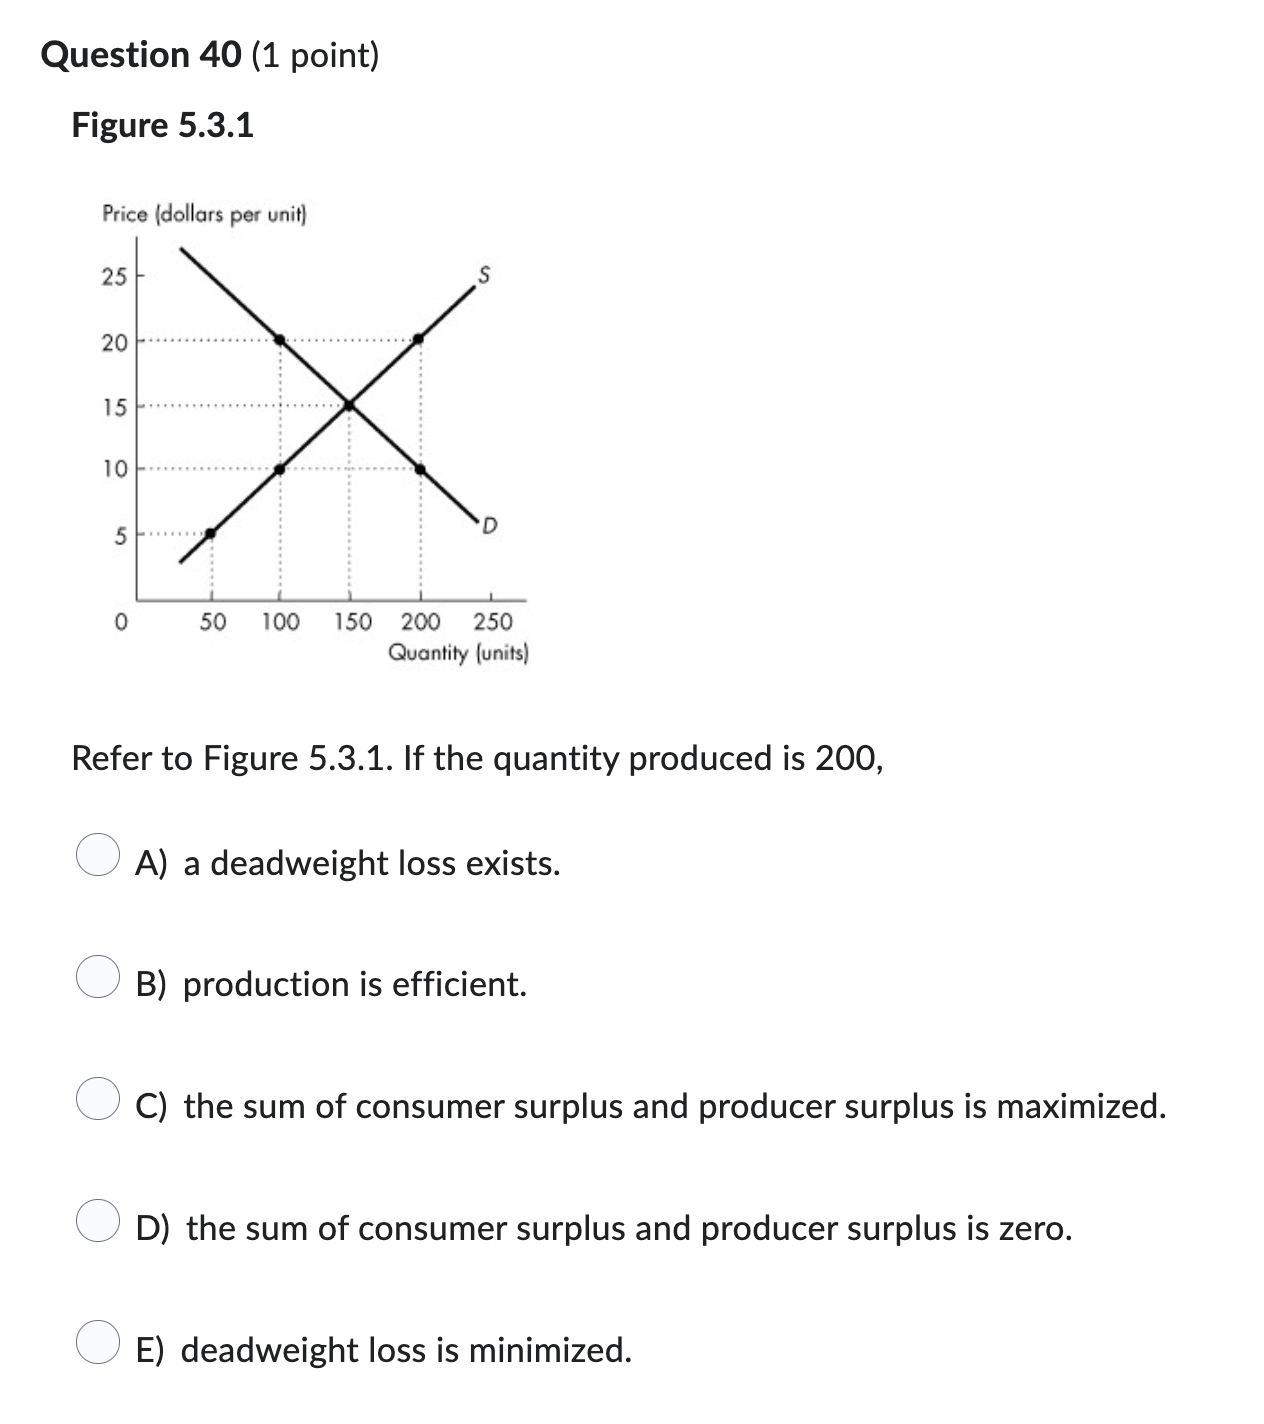
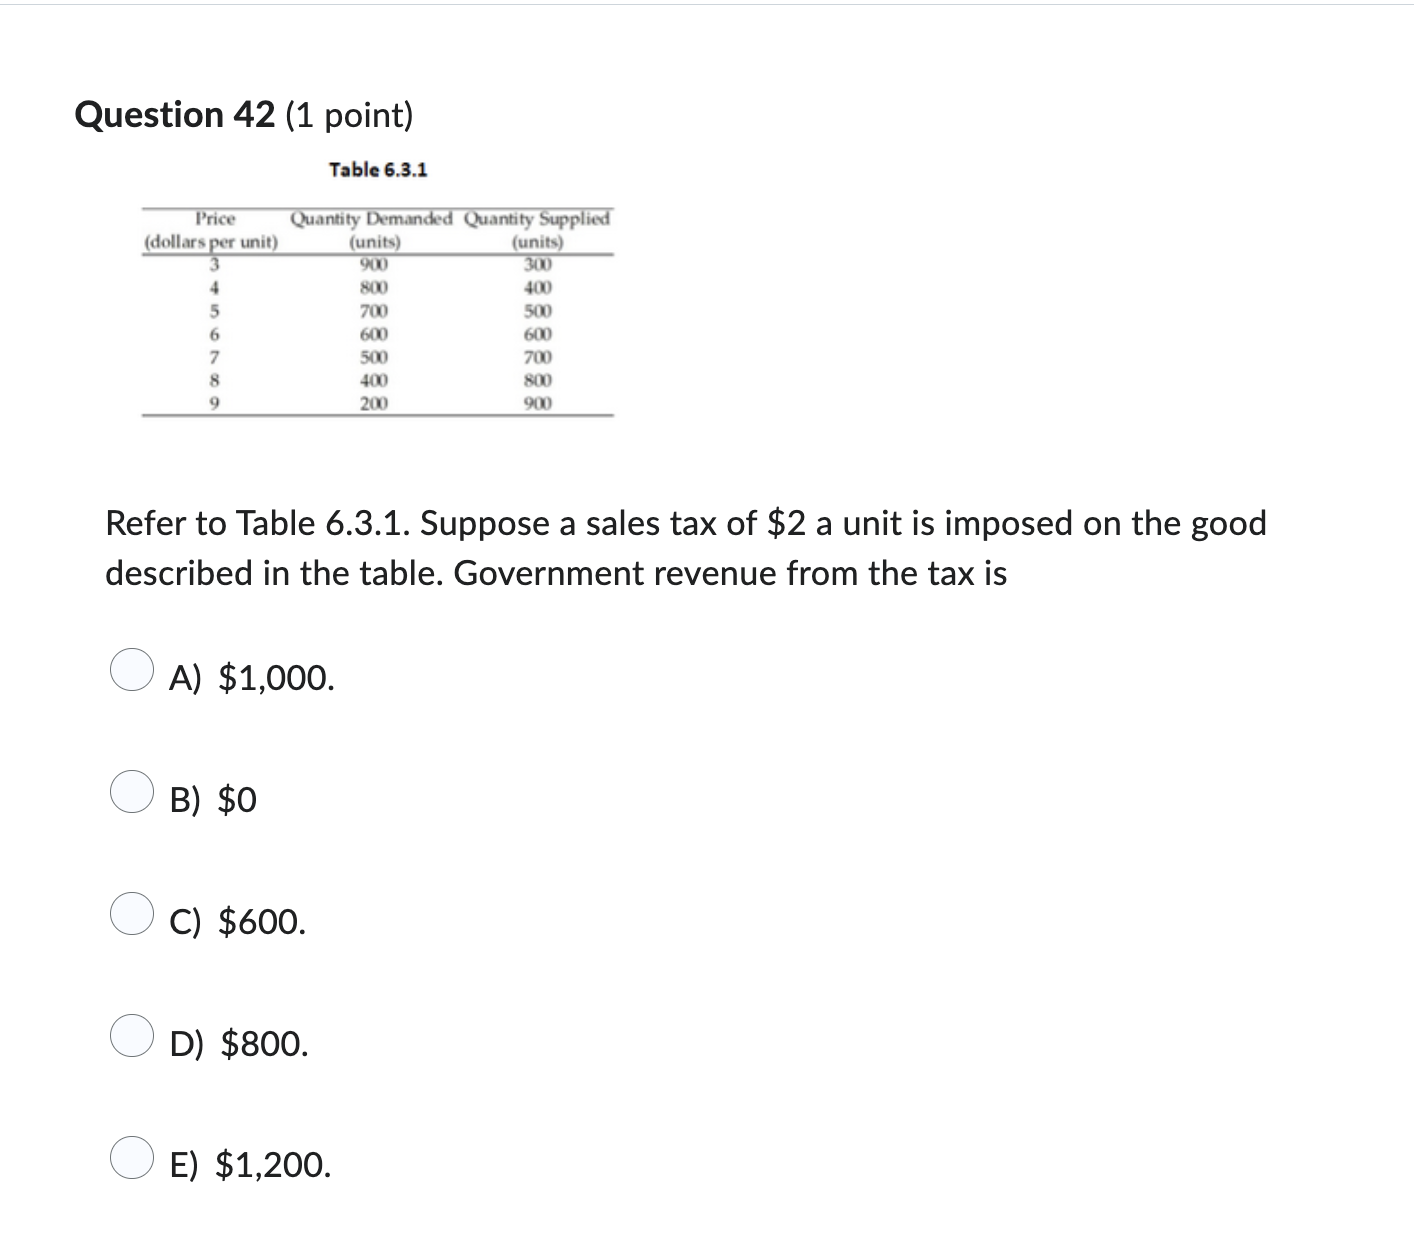
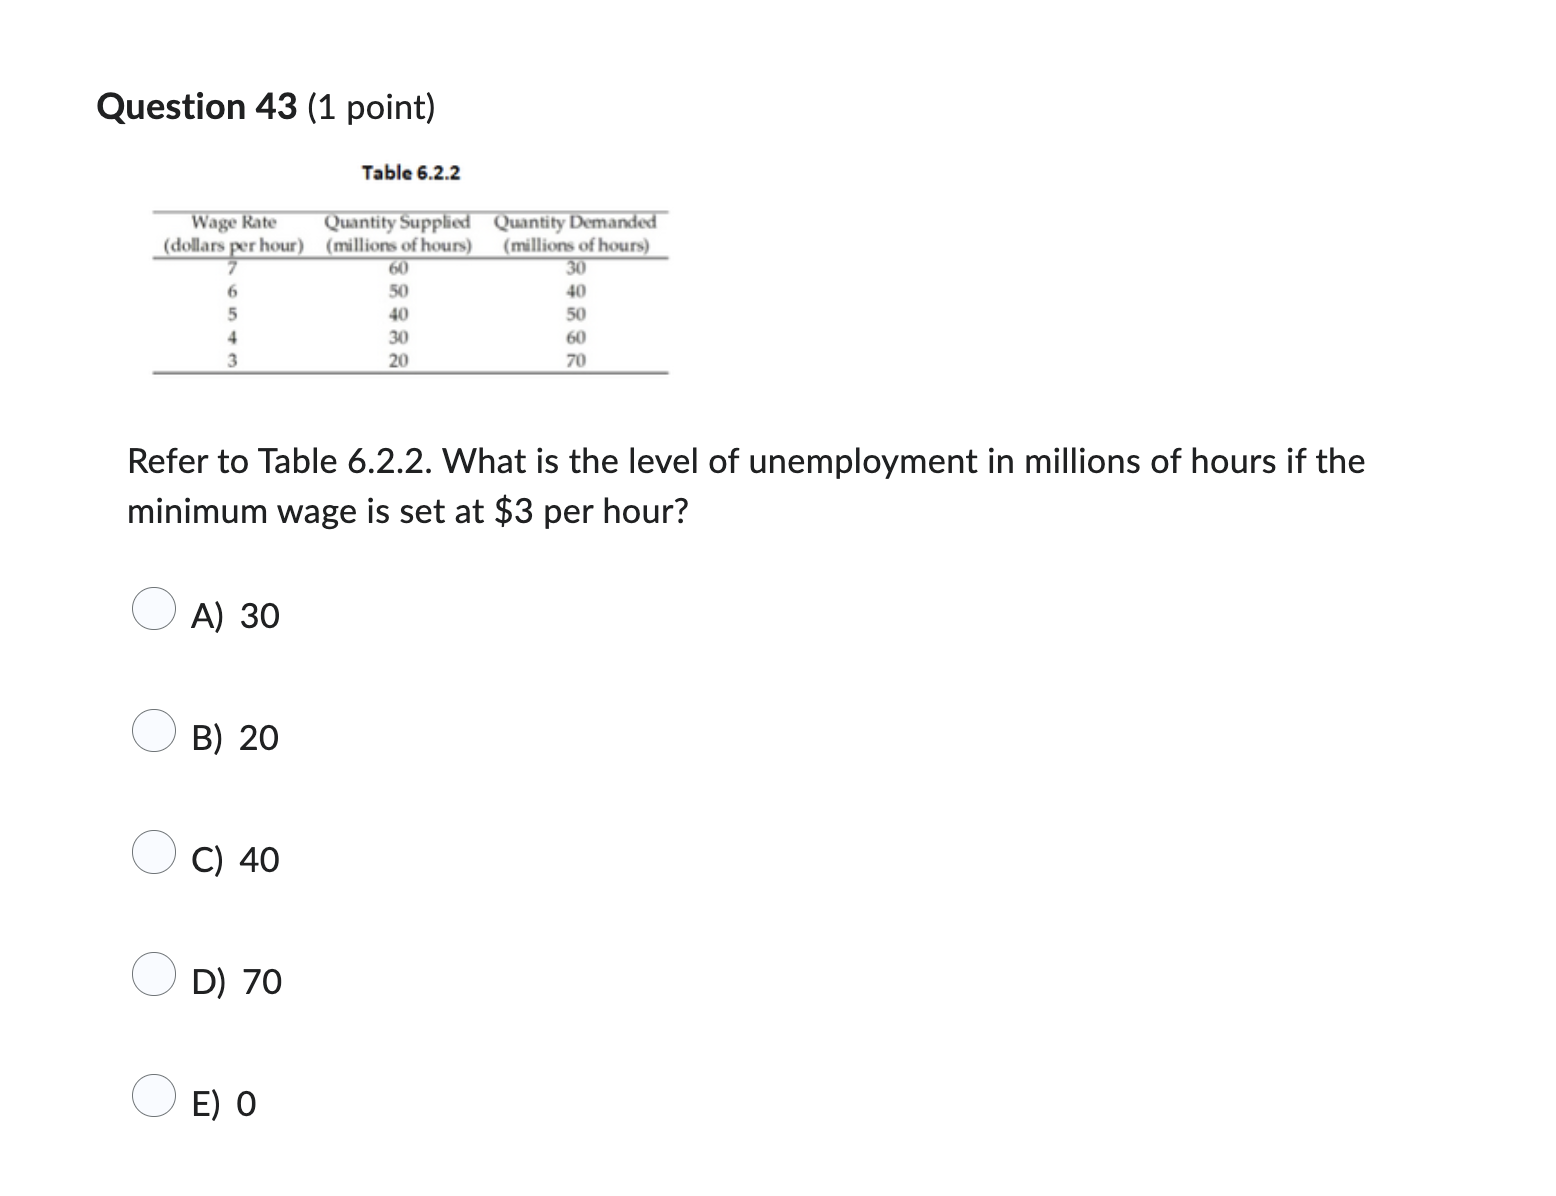
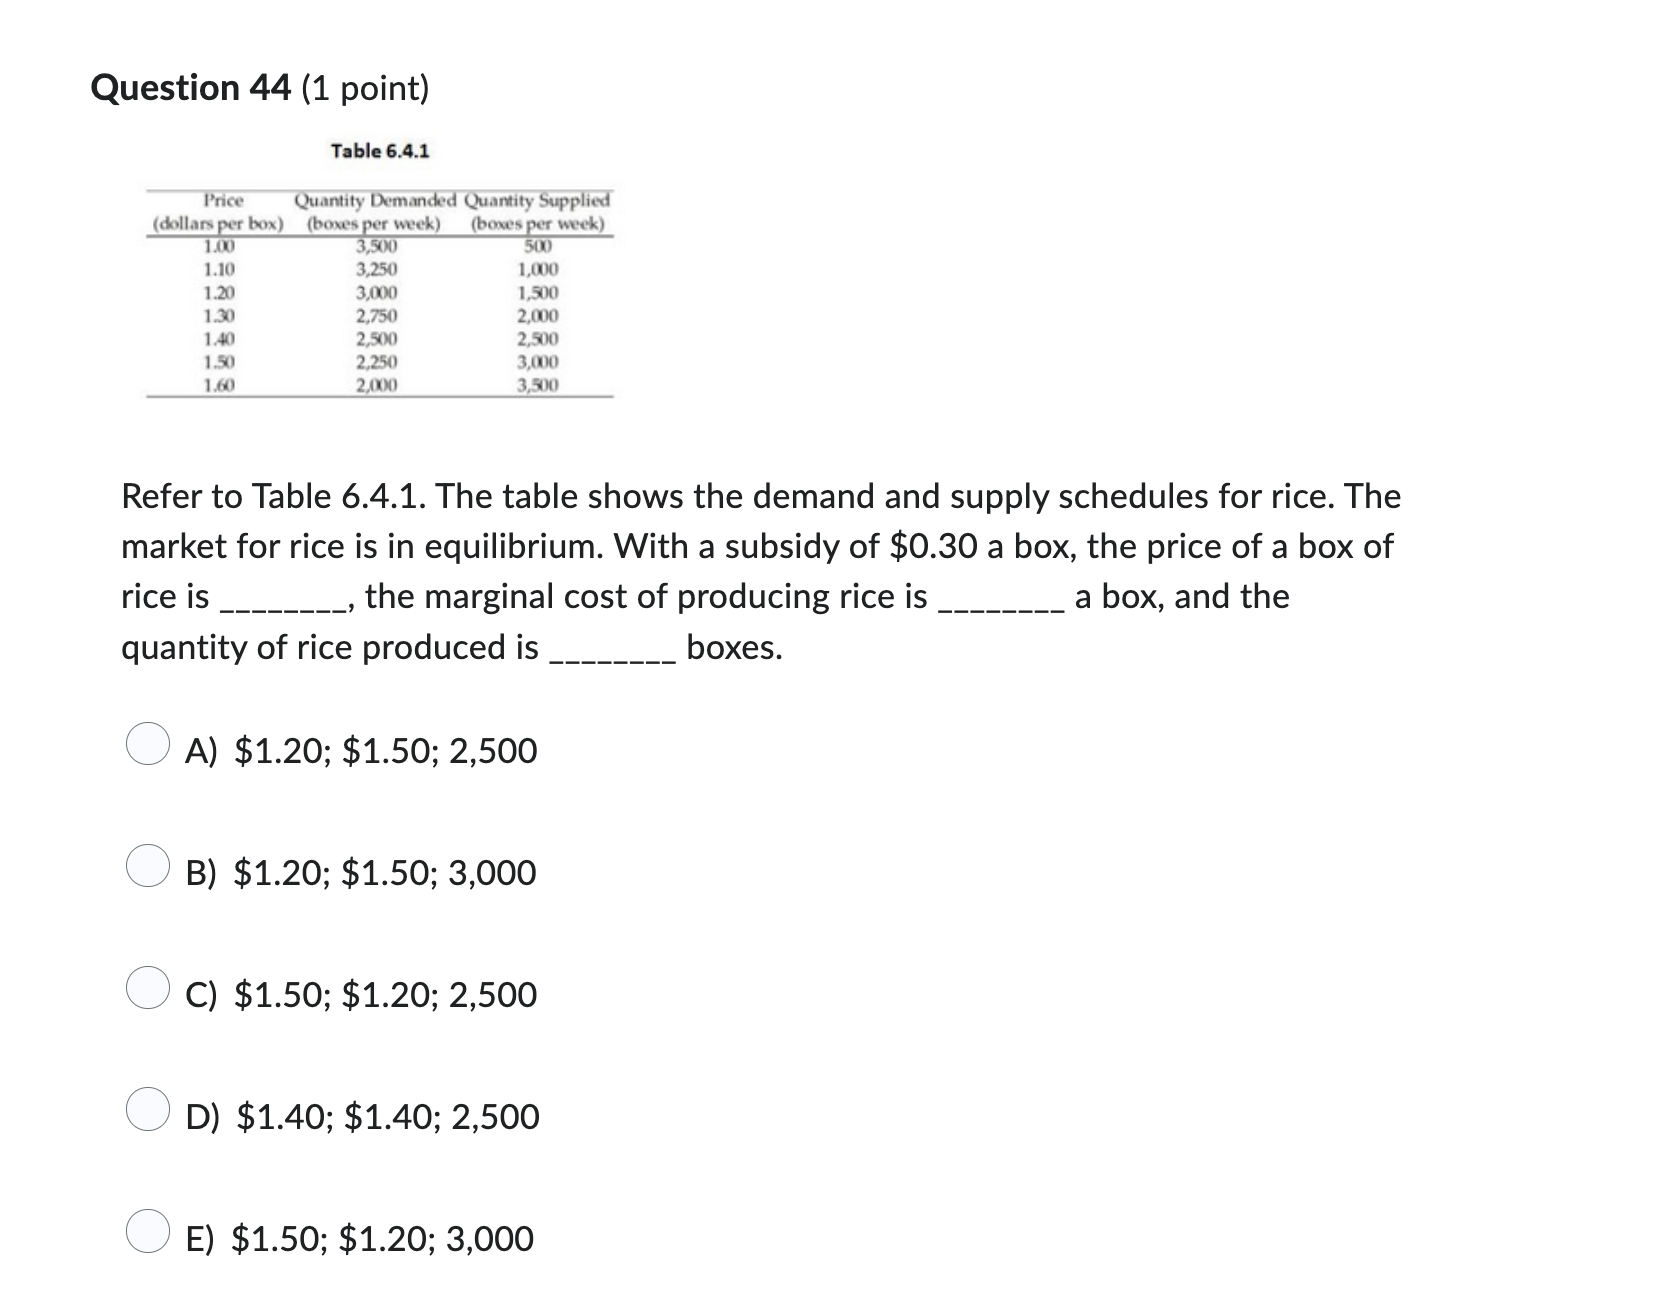
Question 1 (1 point) Household expenditure (thousands of dollars per year) 32 24 16 8 8 16 24 32 40 Household income (thousands of dollars per year) The slope of the line in Figure 1A.3.1 is ( A) 0.50. ( B) 1.00 O c) 1.50. O D) 1.25. O E) 0.75.Question 6 (1 point) Marginal cost and marginal benefit (bottles of pop per bicycle) 0 1 Bicycles (thousands per month) In Figure 2.2.1, when 2,000 bicycles are produced each month, A) the marginal benefit from another bicycle is greater than the marginal cost of another bicycle. QO B) more bicycles must be produced to reach the efficient level of output. C) fewer bicycles must be produced to reach the efficient level of output. D) the economy is efficient at this level of production of bicycles. ) E) both Aand B. Question 7 (1 point) Table 2.1.1 The following table gives points on the production possibilities frontier for goods X and. Point Productionof X Production of Y -a 0 o B 4 36 C 8 28 D 12 16 E 16 0 The diagram of the production possibilities frontier corresponding to the data in Table 2.1.1 would be O A) positively sloped for X and negatively sloped for Y. B) negatively sloped and bowed inward. () ) negatively sloped and bowed outward. ) D) a horizontal line. E) negatively sloped and linear. Table 3.5.2 Demand and Supply Schedules for Cups of Coffee each day at CoolU Quantity Quantity Demanded Supplied Price (cups of coffee (cups of coffee (dollars per cup) per day) per day) 0.70 1,200 0 0.80 1,100 200 0.90 1,000 400 1.00 900 600 1.10 800 800 1.20 700 1,000 1.30 600 1,200 1.40 500 1,400 1.50 400 1,600 Refer to Table 3.5.2. A premature frost destroys half the coffee trees. This change would be represented as a _ A) rightward shift of the supply curve. () B) leftward shift of the supply curve. @, C) movement down along the supply curve. () D) leftward shift of the demand curve. O E) rightward shift of the demand curve. Question 16 (1 point) Table 3.5.1 The Market for Car-Seat Heaters Quantity Quantity Price Demanded Supplied (dollars per (heaters per (heaters per heater) month) month) 40 500 300 50 450 350 60 400 400 70 350 450 80 300 500 90 250 550 100 200 600 Refer to Table 3.5.1. Suppose a problem develops with car-seat heaters - they malfunction and occasionally cause serious burns. As a result, demand decreases by 100 heaters at each price. Simultaneously, the cost of production rises, and supply malfunction and occasionally cause serious burns. As a result, demand decreases by 100 heaters at each price. Simultaneously, the cost of production rises, and supply decreases by 100 heaters at each price. The new equilibrium price is $ and the new equilibrium quantity is heaters per month. () A) 70; 450 () B) 50; 450 () ) 60;300 O b) 50: 350 ) E) 70: 350 Table 3.5.3 Demand and supply schedules for designer sport t-shirts at CoolU Quantity Quantity Price Supplied Demanded (dollars per t- (t-shirts per (t-shirts per shirt) month) month) 3 150 300 4 160 280 5 170 260 180 240 190 220 8 200 200 9 210 180 10 220 160 11 230 140 12 240 120Refer to Table 3.5.3. Suppose that the price of a designer sport t-shirt is $6. The market has leading to O A) a shortage; a fall in the price O B) a shortage; a rise in the price O C) an equilibrium; no change in the price O D) a surplus; a rise in the price O E) a surplus; a fall in the priceQuestion 20 (1 point) Figure 3.4.1 Price S P P, P,|- ; D 0 Q Q@ @ Q Qs Quantity At price P3 in Figure 3.4.1, O A) there is a surplus in the amount of Q5 - Q1. (_J B) equilibrium quantity is Q. C) there is a shortage in the amount of Q5 - Q1. D) this market is in equilibrium. E) there is a tendency for the price to rise. Question 31 (1 point) Figure 5.3.2 Price (dollars per unit) D E G 0 50 100 150 200 250 Quantity (units) Refer to Figure 5.3.2. If the level of output is 200 units, the deadweight loss is area O A) ACG. O B) BCF. O C) ACH. O D) DCE. O E) HCG.Question 32 (1 point) Figure 5.3.2 Price (dollars per unit) A B D H-... G 0 50 100 150 200 250 Quantity (units) Refer to Figure 5.3.2. If the level of output is 100 units, the deadweight loss is area ( A) ACG. (B) HCG. O C) DCE. OD) BCF. OE) ACH.Question 34 (1 point) Figure 5.3.2 Price (dollars per unit) S HI G - D 0 50 100 150 200 250 Quantity (units) Refer to Figure 5.3.2. If the level of output is 150 units, the consumer surplus is area O A) HCG. ( B) ACH. O C) ACG. OD) BCF. OE) DCE.Question 35 (1 point) The marginal cost for Morgan's Marvellous Movies is given in the following table: Table 5.2.2 Quantity Marginal Cost (number of movies) (dollars) 1 4.00 2 4.50 3 5.00 4 5.50 5 6.00 If the firm sells the fifth movie at a price of $7, what is the producer surplus on that movie? If the firm sells the fifth movie at a price of $7, what is the producer surplus on that movie? B $1 Question 37 (1 point) Table 5.2.1 Quantity Marginal Cost (units) (dollars) 1 2 2 > 3 4 4 5 Table 5.2.1 gives information on marginal cost for the XYZ firm. If XYZ sells the first unit at a price of $6, what is the producer surplus on that unit? () D) $12 E) $7 uuestion 57 (1 point) Price [dollars per unif] e e A e e 0 50 100 150 200 250 Quantity [units) Figure 5.3.1 Refer to Figure 5.3.1. If the quantity produced is 100, A) deadweight loss is zero. __ B) marginal social cost exceeds marginal social benefit. () ) marginal social benefit is minimized. ) D) marginal social benefit exceeds marginal social cost. ) E) production is efficient. Question 40 (1 point) Figure 5.3.1 Price (dollars per unit] 0 50 100 150 200 250 Quantity (units) Refer to Figure 5.3.1. If the quantity produced is 200, & A) a deadweight loss exists. () B) production is efficient. . C) the sum of consumer surplus and producer surplus is maximized. __) D) the sum of consumer surplus and producer surplus is zero. * E) deadweight loss is minimized. Question 41 (1 point) Table 6.3.2 Price elasticity of Price elasticity of suppl demand Refer to Table 6.3.2. You are in the business of producing and selling hamburgers, French fries, pizza, and ice cream. The mayor of your city plans to impose a sales tax on one of these products. Based on the elasticities in the table, on which of these goods would your customers least like to be taxed? A) hamburgers . B) ice cream / C) French fries - D) Your customers are indifferent about which good is taxed. Op pizza Question 42 (1 point) Table 6.3.1 Price Quantity Demanded Quantity Supplied (dollars per unit) (units) (units) 900 300 800 400 700 500 600 600 500 700 400 800 200 900 Refer to Table 6.3.1. Suppose a sales tax of $2 a unit is imposed on the good described in the table. Government revenue from the tax is O A) $1,000. ( B) $0 O c) $600. ( D) $800. OE) $1,200.Question 43 (1 point) Table 6.2.2 Wage Rate Quantity Supplied Quantity Demanded (dollars l\\-lhnulh {millions of hours) (millions of hours) 7 6l 30 [ 50 40 5 40 50 4 3 60 3 20 70 Refer to Table 6.2.2. What is the level of unemployment in millions of hours if the minimum wage is set at $3 per hour? () A) 30 Question 44 (1 point) Table 6.4.1 Price Quantity Demanded Quantity Supplied (dollars per box) (boxes per week) (boxes per week) 1.00 3.500 500 1.10 3,250 1,00 1.20 3,000 1,500 1.3 2,750 2,00 1.40 2,500 2.500 1.50 2.250 3,000 1.60 2,000 3,500 Refer to Table 6.4.1. The table shows the demand and supply schedules for rice. The market for rice is in equilibrium. With a subsidy of $0.30 a box, the price of a box of rice is , the marginal cost of producing rice is _ a box, and the quantity of rice produced is boxes. O A) $1.20; $1.50; 2,500 ( B) $1.20; $1.50; 3,000 O c) $1.50; $1.20; 2,500 ( D) $1.40; $1.40; 2,500 OE) $1.50; $1.20; 3,000Question 49 (1 point) Price (dollars per unit) S + tax 100 200 300 400 500 Quantity (units) Figure 6.3.2 Refer to Figure 6.3.2. The seller's share of the tax is O A) $1.50. O B) O O c) $1.00. O D) $0.50. O E) $2.00
Step by Step Solution
There are 3 Steps involved in it

Get step-by-step solutions from verified subject matter experts