

Question: a) Plot point G inside the production possibilities curve and point H outside the curve. Select which point you want to graph from the
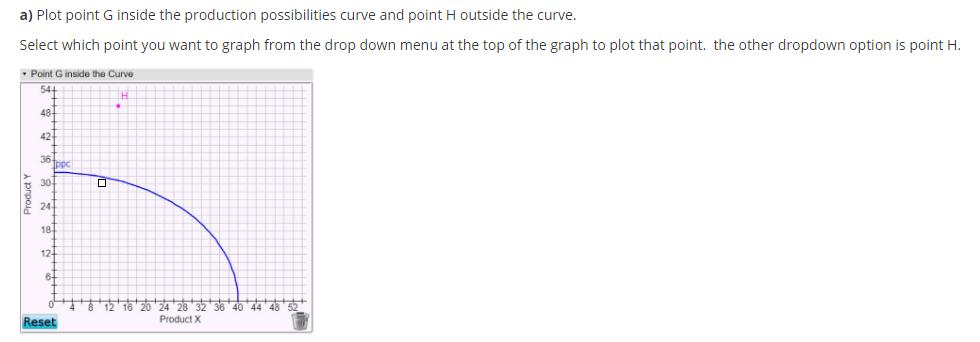
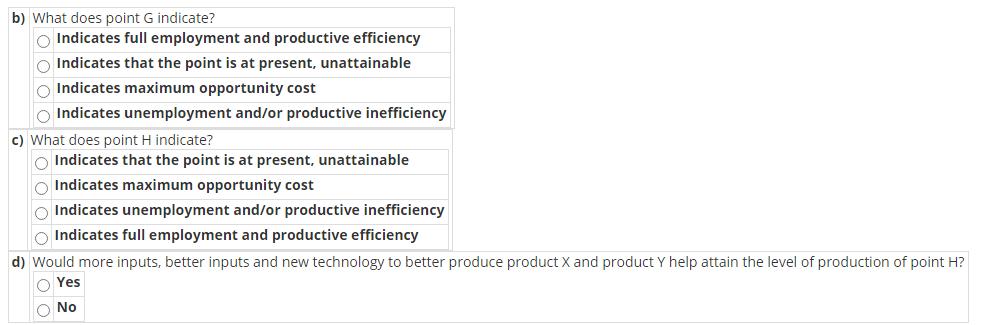
a) Plot point G inside the production possibilities curve and point H outside the curve. Select which point you want to graph from the drop down menu at the top of the graph to plot that point. the other dropdown option is point H. Point Ginside the Curve 544 484 42 36 Ippc 30 24 18 12 48 12 24 28 32 36 40 44 48 52 Product X Reset b) What does point G indicate? O Indicates full employment and productive efficiency o Indicates that the point is at present, unattainable o Indicates maximum opportunity cost o Indicates unemployment and/or productive inefficiency c) What does point H indicate? O Indicates that the point is at present, unattainable o Indicates maximum opportunity cost o Indicates unemployment and/or productive inefficiency o Indicates full employment and productive efficiency d) Would more inputs, better inputs and new technology to better produce product X and product Y help attain the level of production of point H? O Yes O No
Step by Step Solution
3.60 Rating (164 Votes )
There are 3 Steps involved in it
a Graph The production possibility curve is the curve shown on n the digram Inside the curve refers ... View full answer

Get step-by-step solutions from verified subject matter experts