

Question: Answer the following questions. A Trigonometric Model CLASSROOM EXAMPLE 6 Modeling Temperature with a Sine Function The following table shows the mean maximum monthly temperatures
Answer the following questions.
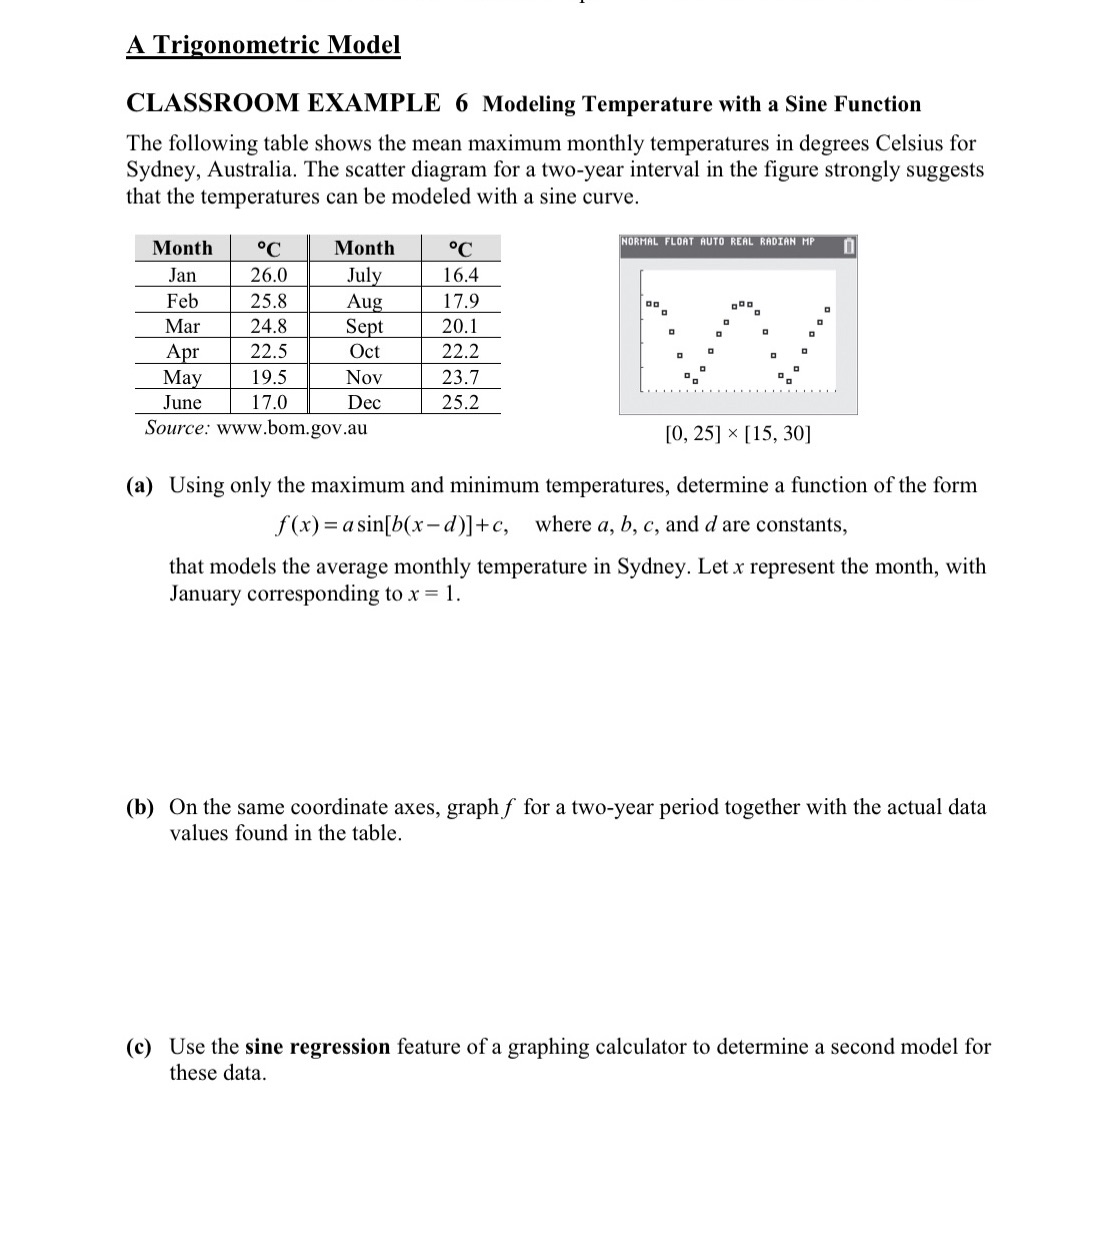
A Trigonometric Model CLASSROOM EXAMPLE 6 Modeling Temperature with a Sine Function The following table shows the mean maximum monthly temperatures in degrees Celsius for Sydney, Australia. The scatter diagram for a two-year interval in the figure strongly suggests that the temperatures can be modeled with a sine curve. Month .C Month .C NORMAL FLOAT AUTO REAL RADIAN MP Jan 26.0 July 16.4 Feb 25.8 Aug 17.9 Mar 24.8 Sept 20.1 Apr 22.5 Oct 22.2 May 19.5 Nov 23.7 June 17.0 Dec 25.2 Source: www.bom.gov.au [0, 25] x [15, 30] (a) Using only the maximum and minimum temperatures, determine a function of the form f(x) = asin[b(x-d)]+c, where a, b, c, and d are constants, that models the average monthly temperature in Sydney. Let x represent the month, with January corresponding to x = 1. (b) On the same coordinate axes, graph f for a two-year period together with the actual data values found in the table. (c) Use the sine regression feature of a graphing calculator to determine a second model for these data
Step by Step Solution
There are 3 Steps involved in it

Get step-by-step solutions from verified subject matter experts