

Question: Answer the following questions about the plot below. Fig. 1-4 X-ray spectrum of molybdenum as a function of applied voltage (schematic). Line widths not to
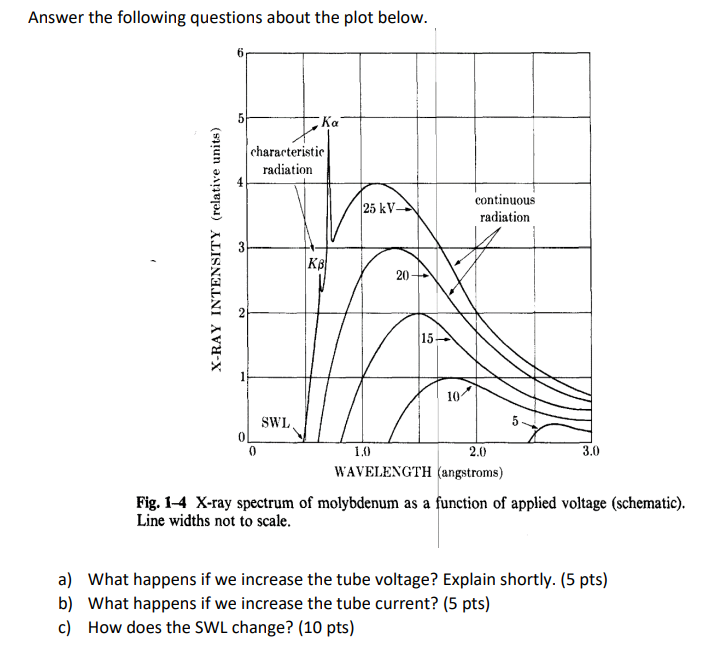
Answer the following questions about the plot below. Fig. 1-4 X-ray spectrum of molybdenum as a function of applied voltage (schematic). Line widths not to scale. a) What happens if we increase the tube voltage? Explain shortly. (5 pts) b) What happens if we increase the tube current? (5 pts) c) How does the SWL change? (10 pts)
Step by Step Solution
There are 3 Steps involved in it
1 Expert Approved Answer
Step: 1 Unlock

Question Has Been Solved by an Expert!
Get step-by-step solutions from verified subject matter experts
Step: 2 Unlock
Step: 3 Unlock