Question: Answer the following questions based on information below:- Compare/contrast your recommendations versus the company's plans, and/or with a rival company's plans on pepsico. Show several
Answer the following questions based on information below:-
Compare/contrast your recommendations versus the company's plans, and/or with a rival company's plans on pepsico.
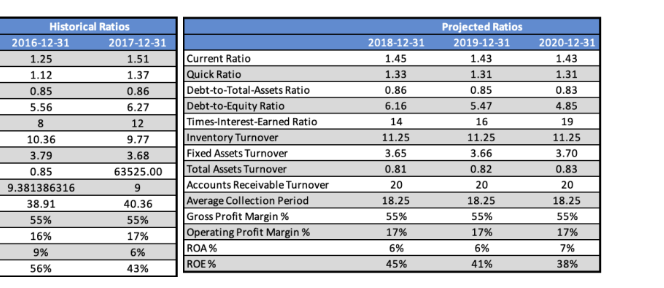
Show several projected financial ratios to reveal the firm's improving financial position on Pepsico.
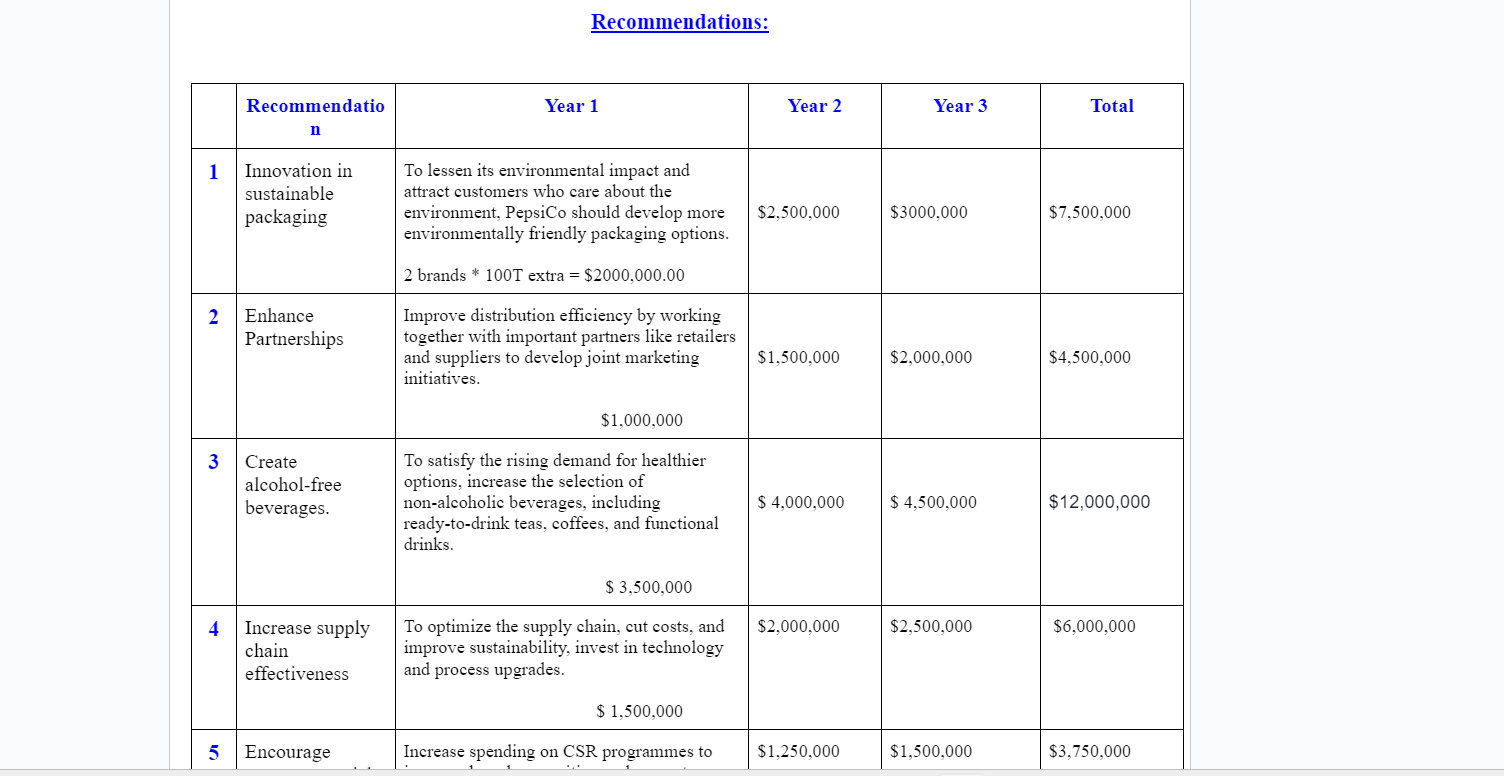
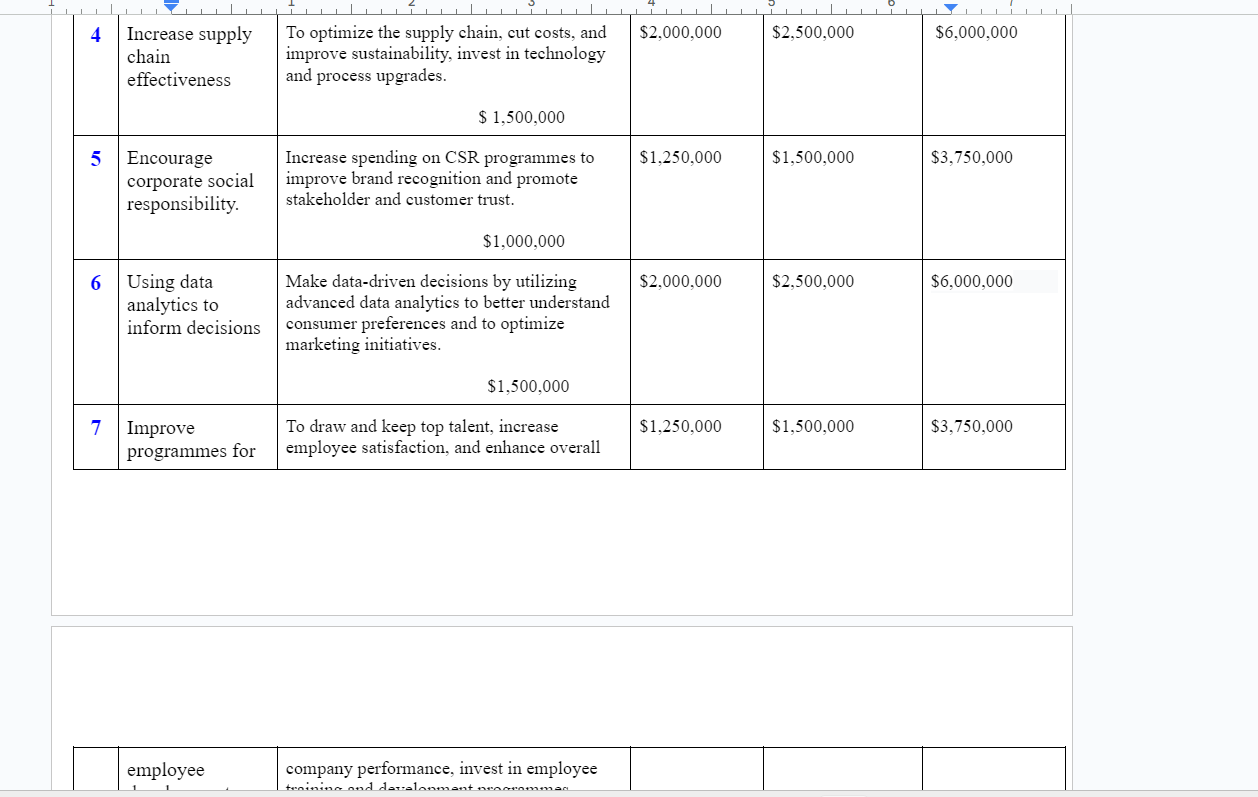
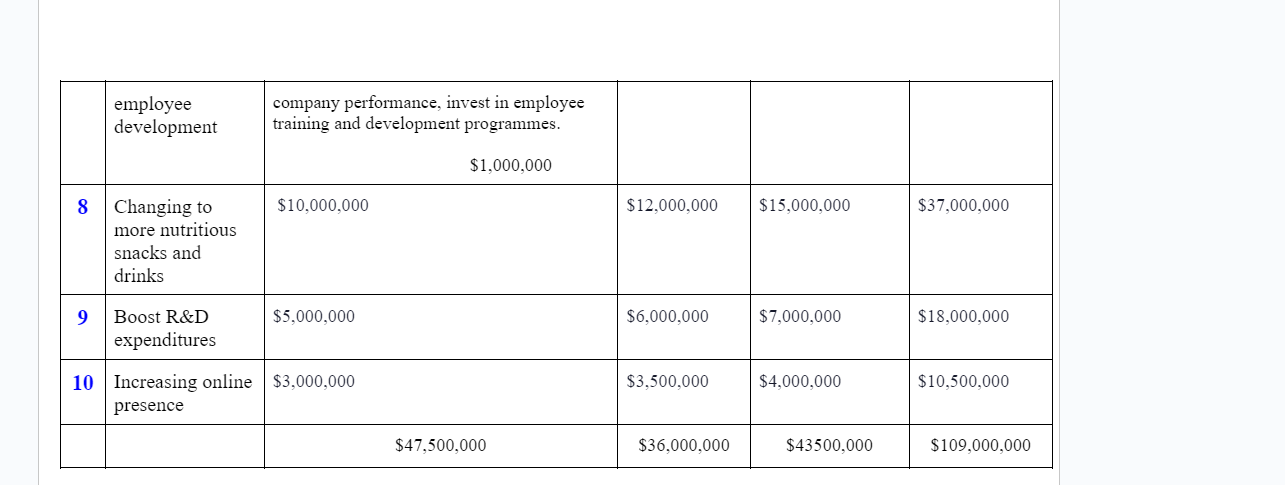
Recommendations: Recommendatio Year 1 Year 2 Year 3 Total n Innovation in To lessen its environmental impact and sustainable attract customers who care about the packaging environment, PepsiCo should develop more $2,500,000 $3000,000 $7,500,000 environmentally friendly packaging options. 2 brands * 100T extra = $2000,000.00 2 Enhance Improve distribution efficiency by working Partnerships together with important partners like retailers and suppliers to develop joint marketing $1,500,000 $2,000,000 $4,500,000 initiatives. $1,000,000 3 Create To satisfy the rising demand for healthier alcohol-free options, increase the selection of beverages. non-alcoholic beverages, including $ 4,000,000 $ 4,500,000 $12,000,000 ready-to-drink teas, coffees, and functional drinks. $ 3,500,000 4 Increase supply To optimize the supply chain, cut costs, and $2,000,000 $2,500,000 $6,000,000 chain improve sustainability, invest in technology effectiveness and process upgrades. $ 1,500,000 5 Encourage Increase spending on CSR programmes to $1,250,000 $1,500,000 $3,750,000Increase supply To optimize the supply chain, cut costs, and $2,000,000 $2,500,000 $6,000,000 chain improve sustainability, invest in technology effectiveness and process upgrades. $ 1,500,000 5 Encourage Increase spending on CSR programmes to $1,250,000 $1,500,000 $3,750,000 corporate social improve brand recognition and promote responsibility. stakeholder and customer trust $1,000,000 6 Using data Make data-driven decisions by utilizing $2,000,000 $2,500,000 $6,000,000 analytics to advanced data analytics to better understand inform decisions consumer preferences and to optimize marketing initiatives. $1,500,000 7 Improve To draw and keep top talent, increase $1,250,000 $1,500,000 $3,750,000 programmes for employee satisfaction, and enhance overall employee company performance, invest in employee training and development neogrammasemployee company performance, invest in employee development training and development programmes. $1,000,000 8 Changing to $10,000,000 $12,000,000 $15,000,000 $37,000,000 more nutritious snacks and drinks 9 Boost R&D $5,000,000 $6,000,000 $7,000,000 $18,000,000 expenditures 10 Increasing online $3,000,000 $3,500,000 $4,000,000 $10,500,000 presence $47,500,000 $36,000,000 $43500,000 $109,000,000Historical Ratios Projected Ratios 2016-12-31 2017-12-31 2018-12-31 2019-12-31 2020-12-31 1.25 1.51 Current Ratio 1.45 1.43 1.43 1.12 1.37 Quick Ratio 1.33 1.31 1.31 0.85 0.86 Debt-to-Total-Assets Ratio 0.86 0.85 0.83 5.56 6.27 Debt-to-Equity Ratio 6.16 5.47 4.85 8 12 Times-Interest-Earned Ratio 14 16 19 10.36 9.77 Inventory Turnover 11.25 11.25 11.25 3.79 3.68 Fixed Assets Turnover 3.65 3.66 3.70 0.85 63525.00 Total Assets Turnover 0.81 0.82 0.83 9.381386316 9 Accounts Receivable Turnover 20 20 20 38.91 40.36 Average Collection Period 18.25 18.25 18.25 55% 55% Gross Profit Margin % 55% 55% 55% 16% 17% Operating Profit Margin % 17% 17% 17% 9% 6% ROA % 6% 6% 7% 56% 43% ROE % 45% 41% 38%
Step by Step Solution
There are 3 Steps involved in it
1 Expert Approved Answer
Step: 1 Unlock
Question Has Been Solved by an Expert!
Get step-by-step solutions from verified subject matter experts
Step: 2 Unlock
Step: 3 Unlock
Students Have Also Explored These Related Finance Questions!