

Question: Answer the following questions: One-Sample Study (tap-only) a. Estimate (using a 95% confidence interval) the true mean weight gain. Interpret. b. Abrams et al. (2000)
Answer the following questions: One-Sample Study (tap-only)
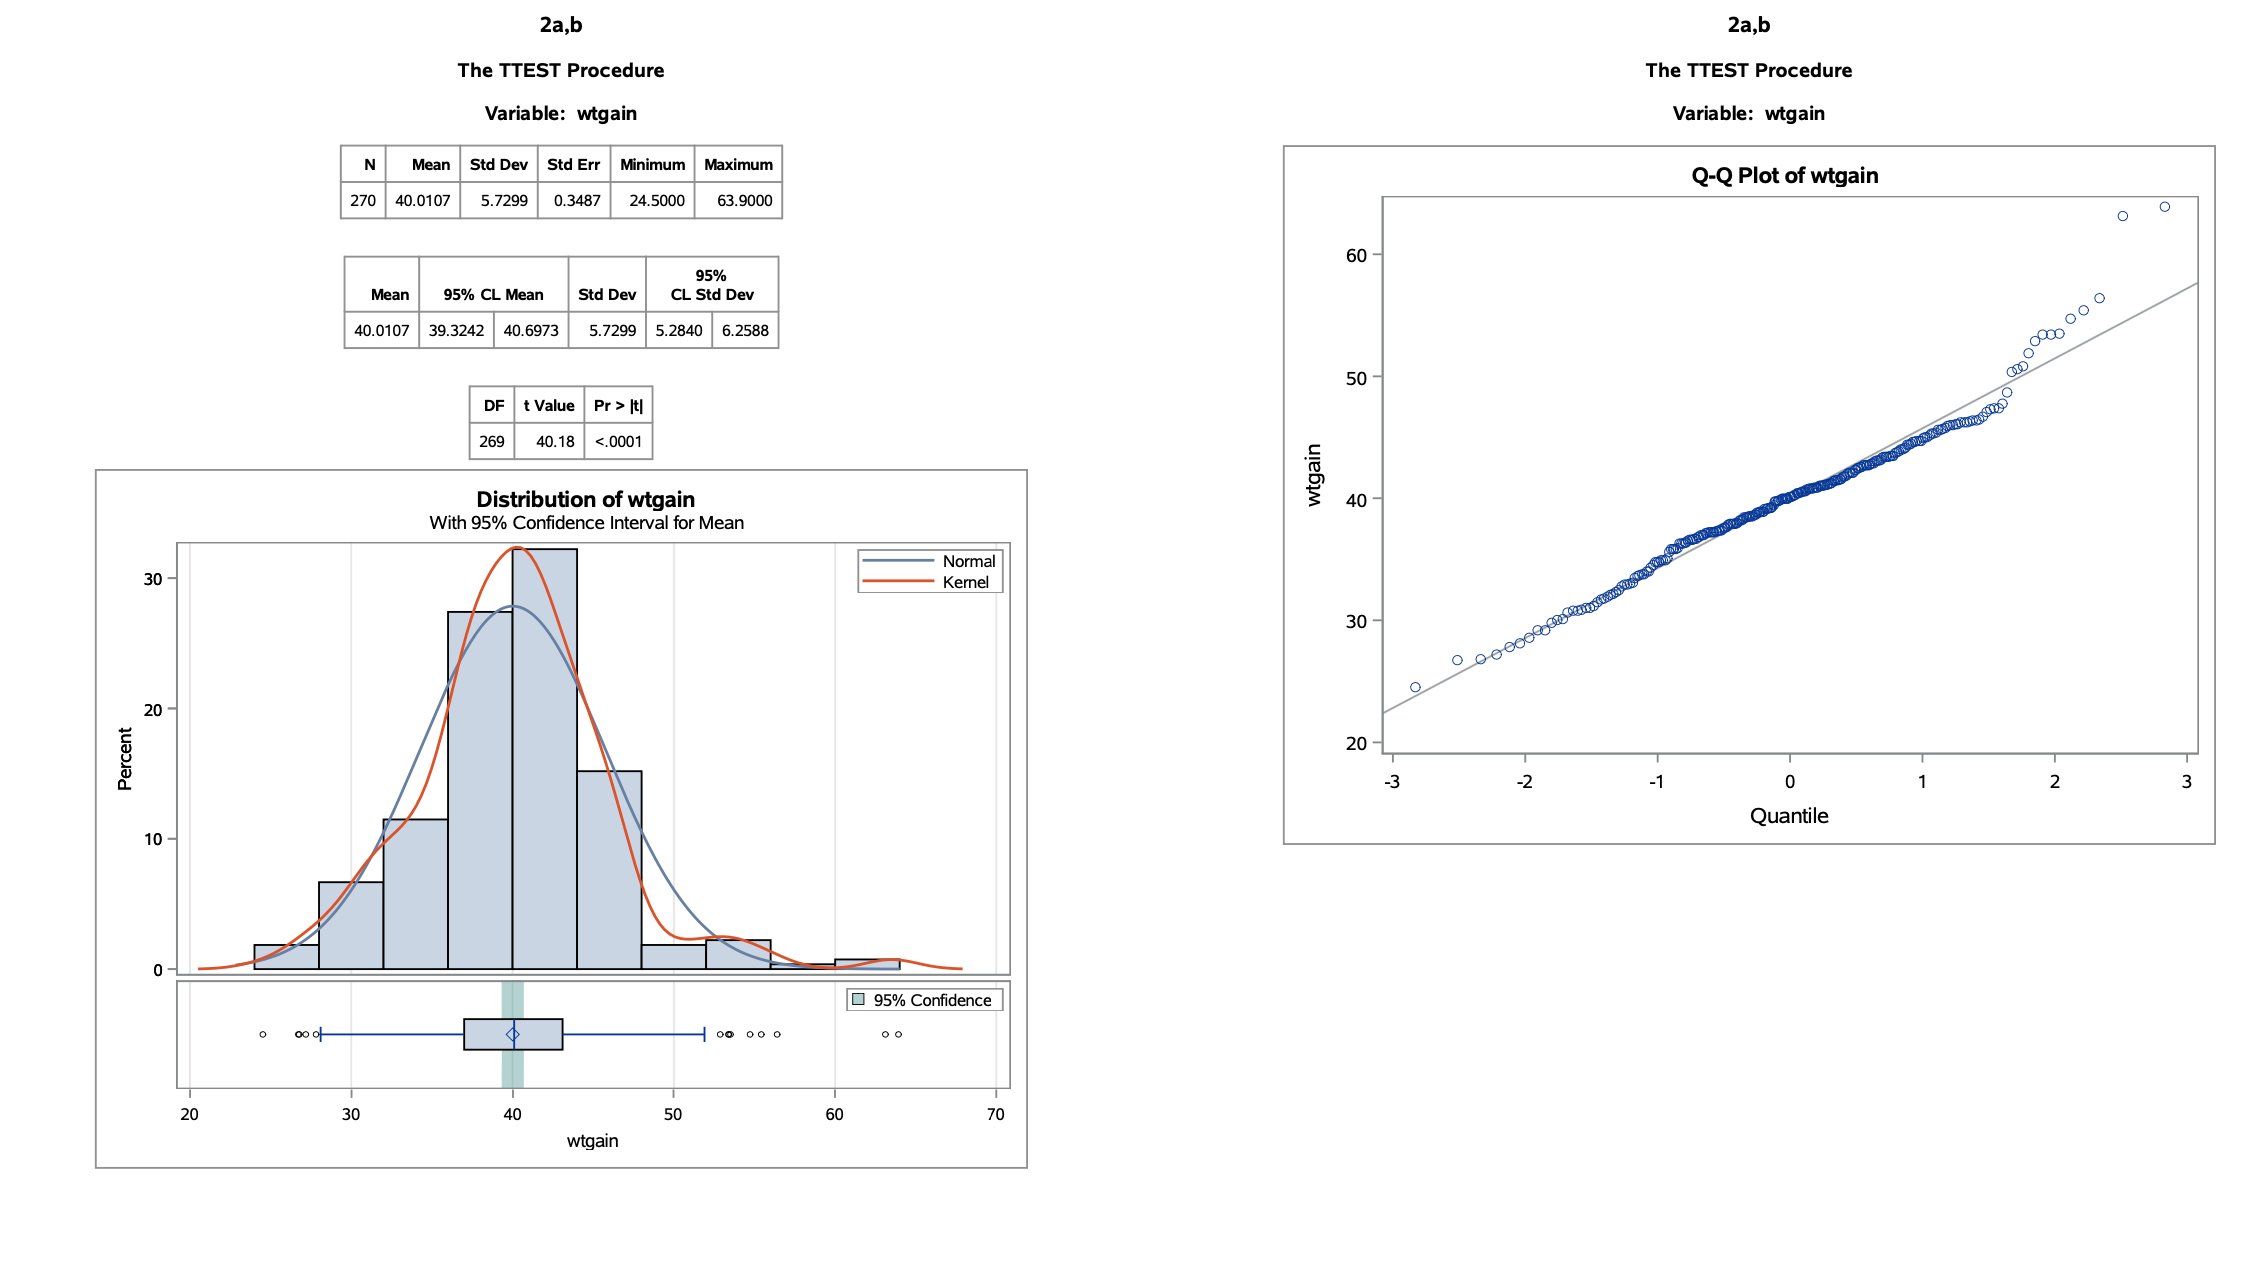
a. Estimate (using a 95% confidence interval) the true mean weight gain. Interpret.
b. Abrams et al. (2000) reported that the healthy pregnant women are generally
advised to limit weight gain to approximately 26 pounds. Is the weight gain different
in the sample of women who drank only tap water? Use statistical inference to justify
your answer.
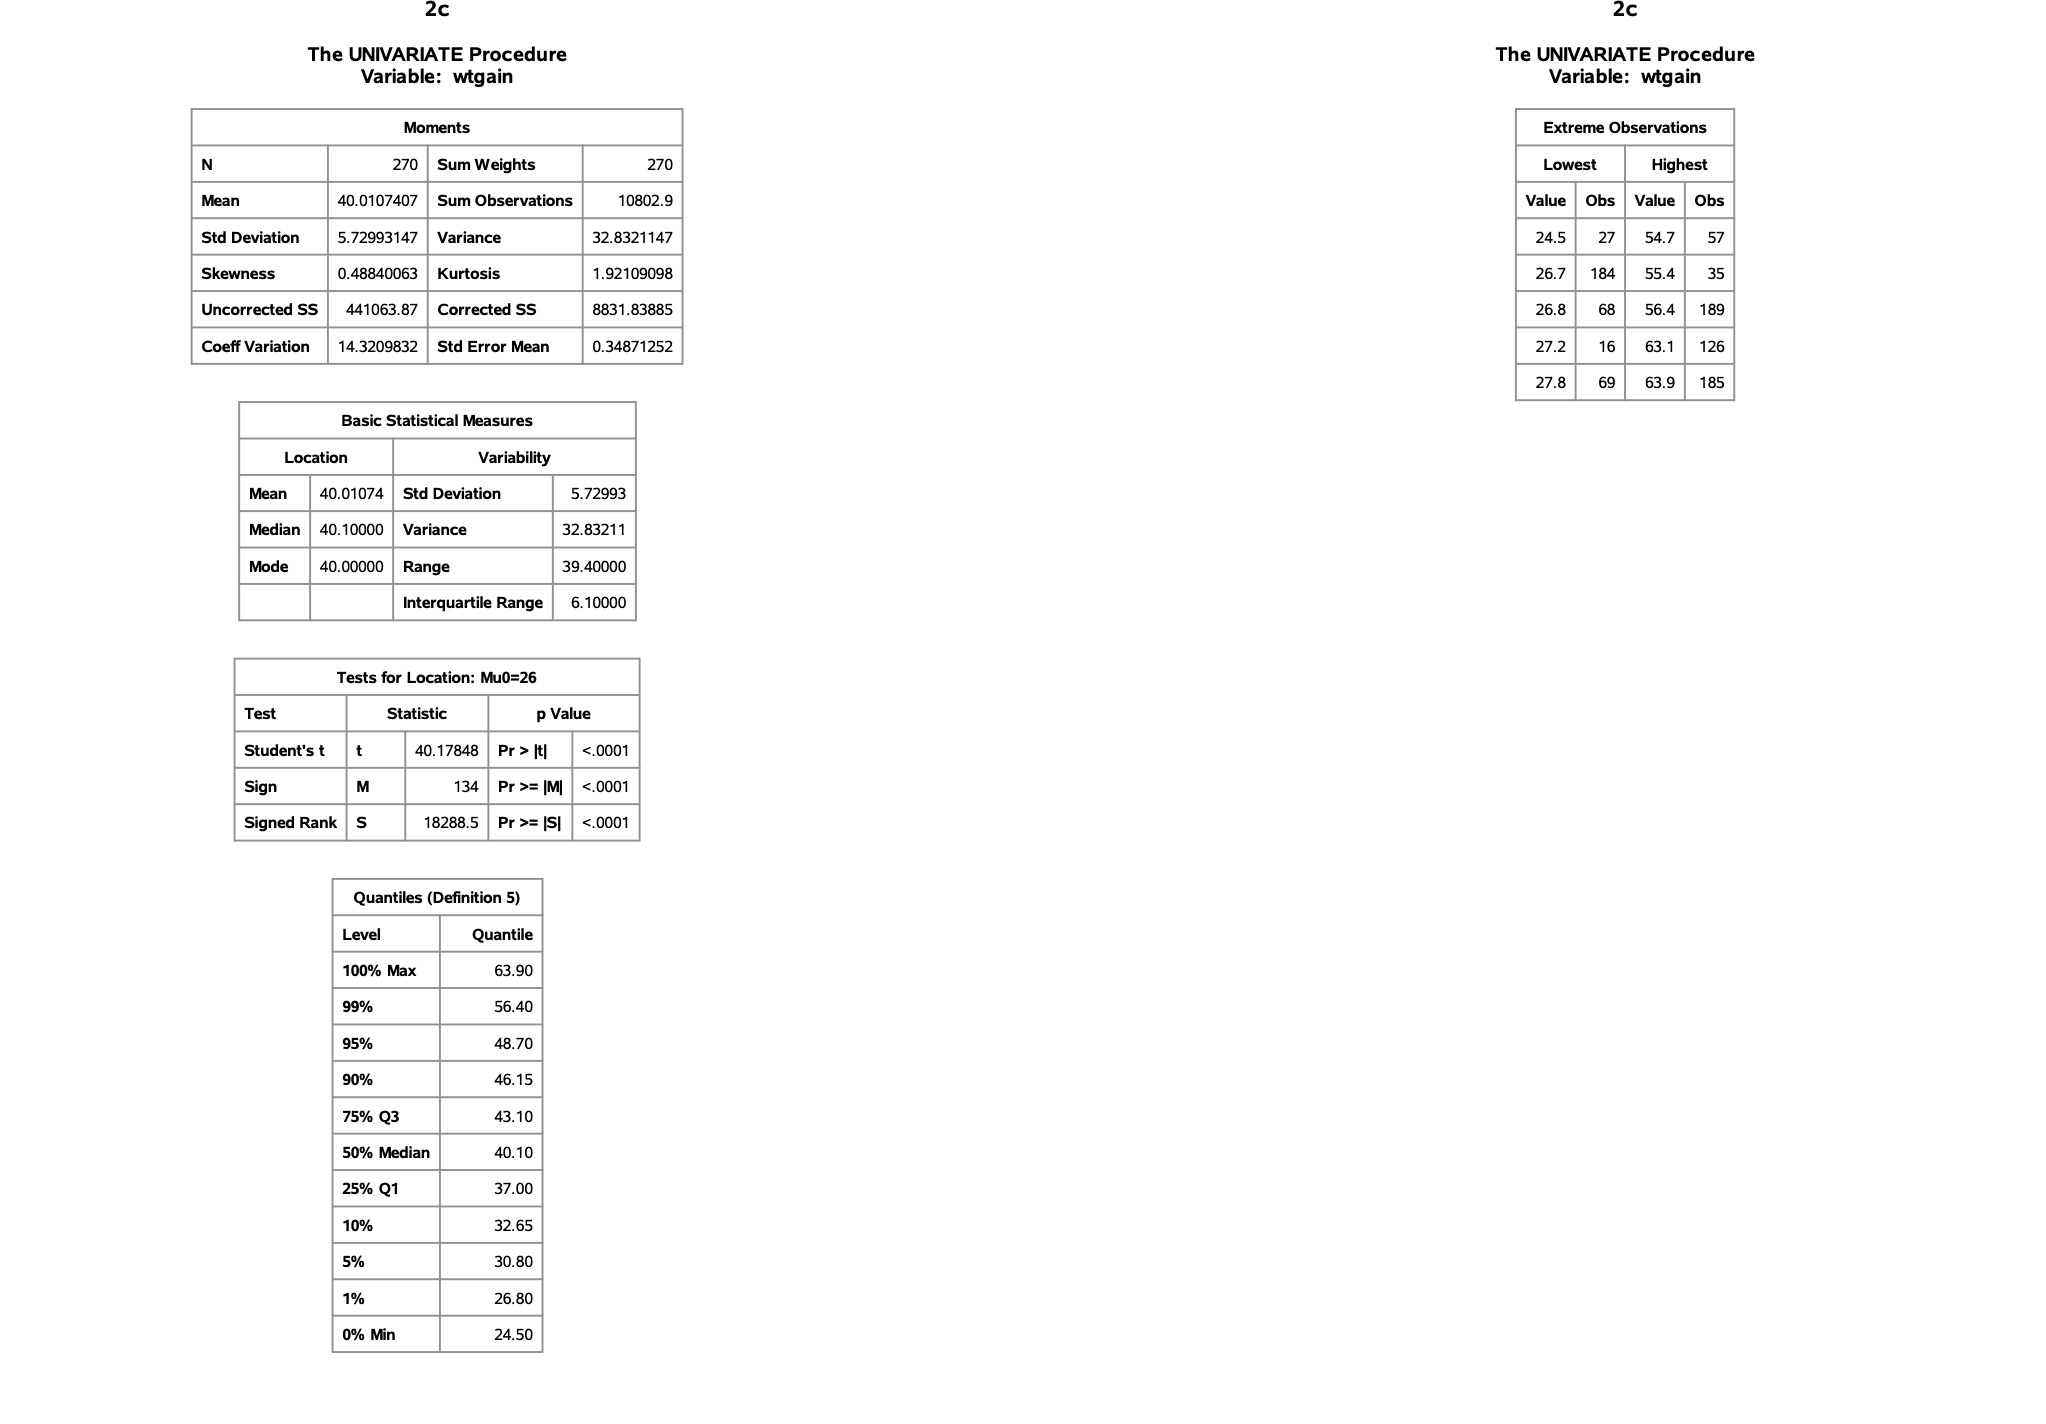
c. Suppose that a normal distribution could not be assumed for the weight change. Use
a signed rank test to determine whether the change in this population is different
from the historical control (26 pounds). Provide an interpretation of the results.
References
Attached the data report
2a,b 2a,b The TTEST Procedure The TTEST Procedure Variable: wtgain Variable: wtgain N Mean Std Dev Std Err Minimum Maximum Q-Q Plot of wtgain 270 40.0107 5.7299 0.3487 24.5000 63.9000 O O 60 95% Mean 95% CL Mean Std Dev CL Std Dev 40.0107 39.3242 40.6973 5.7299 5.2840 6.2588 50 - DF t Value Pr > It| 269 40.18 <.0001 wtgain distribution of with confidence interval for mean normal kernel o percent w quantile oo oc wtgain2c the univariate procedure variable: wtgair moments extreme observations n sum weights lowes highest value obs std deviation variance skewness kurtosis uncorrected ss corrected coeff variation error basic statistical measures location variability median mode interquartile range tests location: mu0="26" test statistic p student t pr> It| <.0001 sign pr>= [M| <.0001 signed rank s pr>= |S| <.0001 quantiles leve quantile max q3 median q1 min>
Step by Step Solution
There are 3 Steps involved in it

Get step-by-step solutions from verified subject matter experts