

Question: Answer the following questions: Use the graph to answer the following question 10 Real GDP annual change, in % Inflation e-o-p, in % 8 -
Answer the following questions:
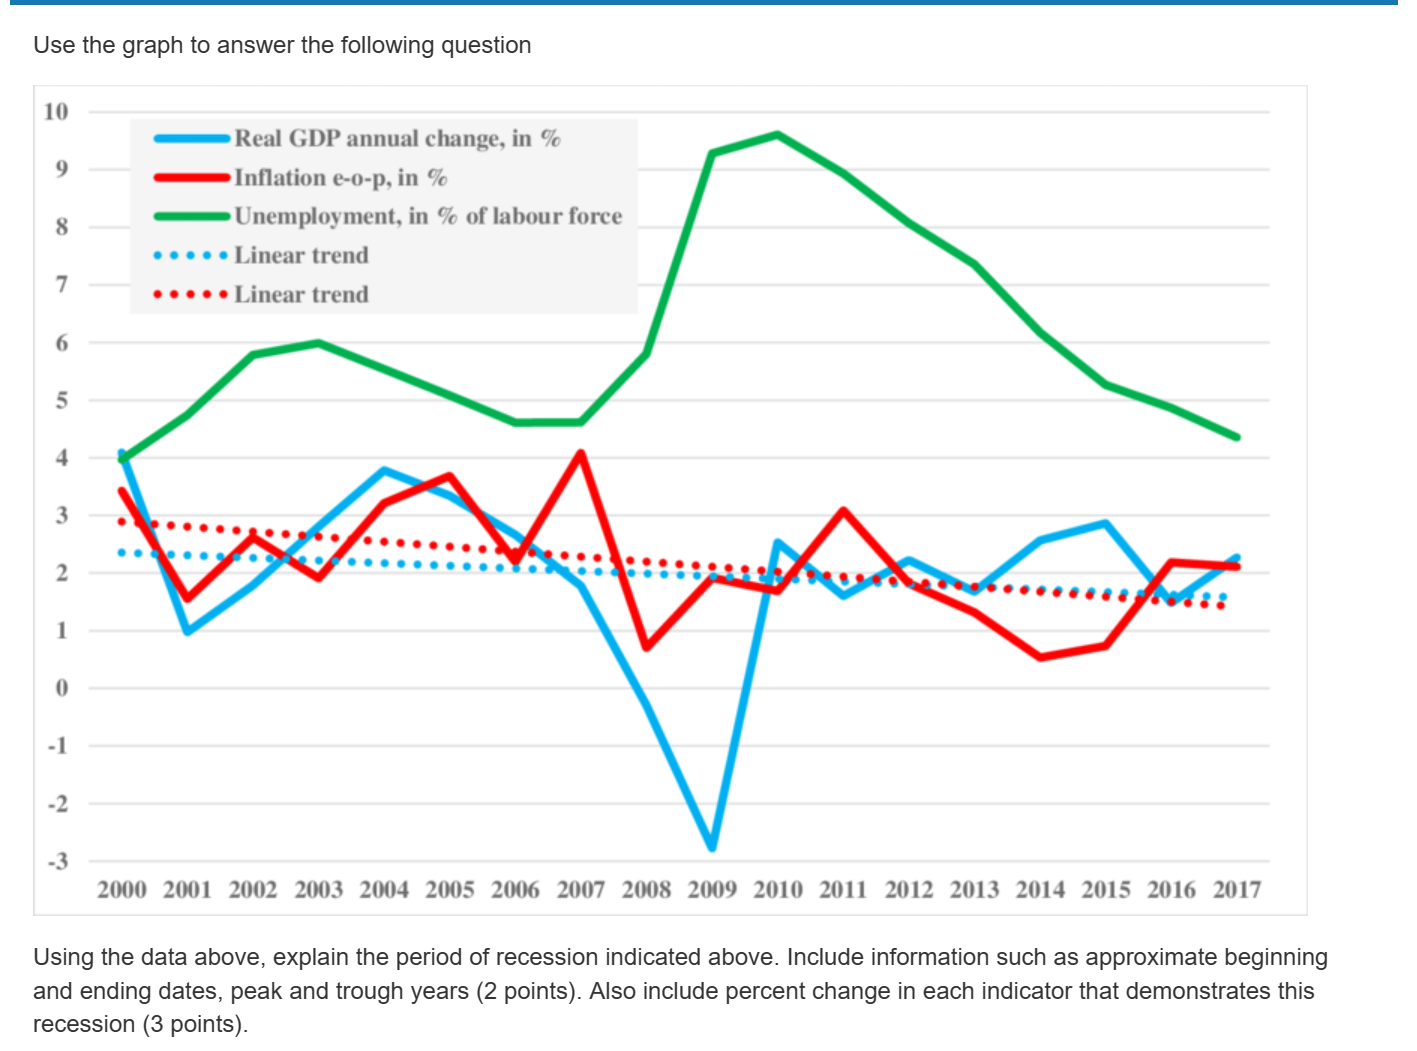
Use the graph to answer the following question 10 Real GDP annual change, in % Inflation e-o-p, in % 8 - Unemployment, in % of labour force . . . . . Linear trend 7 . . . . . Linear trend a A . . . . . . . . . . . N . . . . . . . . . . . . . . 6 8 : -2 -3 2000 2001 2002 2003 2004 2005 2006 2007 2008 2009 2010 2011 2012 2013 2014 2015 2016 2017 Using the data above, explain the period of recession indicated above. Include information such as approximate beginning and ending dates, peak and trough years (2 points). Also include percent change in each indicator that demonstrates this recession (3 points).A stockbroker loses his job during an economic downturn. This would be an example of (7 point) O frictional unemployment O seasonal unemployment O cyclical unemployment (O structural unemployment
Step by Step Solution
There are 3 Steps involved in it

Get step-by-step solutions from verified subject matter experts