

Question: Answer the following questions using the chart provided 1) Do you feel that certain sectors of our economy were harder hit than others? Were there
Answer the following questions using the chart provided
1) Do you feel that certain sectors of our economy were harder hit than others? Were there some that were relatively unscathed?
2) Overall, do you feel the efforts made by the federal government were effective? Explain why.What are your suggestions going forward?
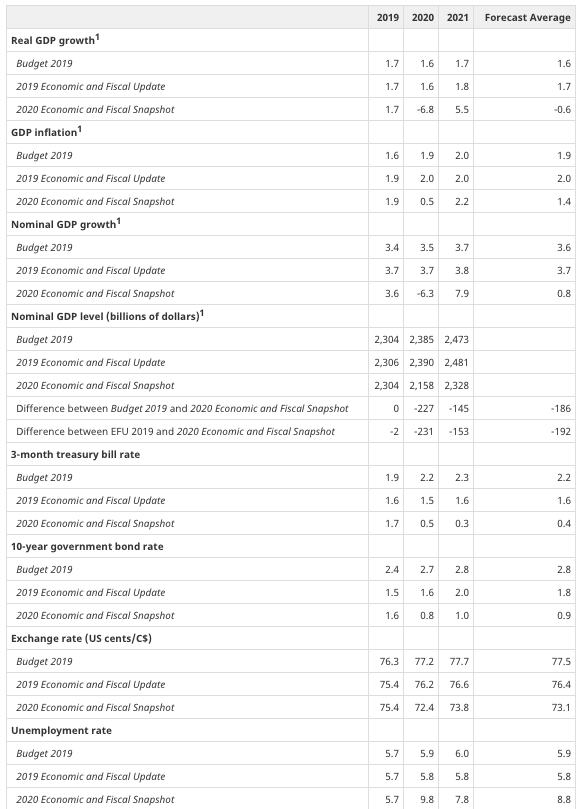
2019 2020 2021 Forecast Average Real GDP growth Budget 2019 1.7 1.6 1.7 1.6 2019 Economic and Fiscal Update 1.7 1.6 1.8 1.7 2020 Economic and Fiscal Snapshot 1.7 6.8 5.5 -0.6 GDP inflation Budget 2019 1.6 1.9 2.0 1.9 2019 Economic and Fiscal Update 1.9 2.0 2.0 2.0 2020 Economic and Fiscal Snapshot 1.9 0.5 2.2 1.4 Nominal GDP growth Budget 2019 3.4 3.5 3.7 3.6 2019 Economic and Fiscal Update 3.7 3.7 3.8 3.7 2020 Economic and Fiscal Snapshot 3.6 6.3 7.9 0.8 Nominal GDP level (billions of dollars) Budget 2019 2,304 2,385 2,473 2019 Economic and Fiscal Update 2,306 2,390 2,481 2020 Economic and Fiscal Snapshot 2,304 2,158 2,328 Difference between Budget 2019 and 2020 Economic and Fiscal Snapshot -227 -145 -186 Difference between EFU 2019 and 2020 Economic and Fiscal Snapshot -2 -231 -153 -192 3-month treasury bill rate Budget 2019 1.9 2.2 2.3 2.2 2019 Economic and Fiscal Update 1.6 1.5 1.6 1.6 2020 Economic and Fiscal Snapshot 1.7 0.5 0.3 0.4 10-year government bond rate Budget 2019 2.4 2.7 2.8 2.8 2019 Economic and Fiscal Update 1.5 1.6 2.0 1.8 2020 Economic and Fiscal Snapshot 1.6 0.8 1.0 0.9 Exchange rate (US cents/C$) Budget 2019 76.3 77.2 77.7 77.5 2019 Economic and Fiscal Update 75.4 76.2 76.6 76.4 2020 Economic and Fiscal Snapshot 75.4 72.4 73.8 73.1 Unemployment rate Budget 2019 5.7 5.9 6.0 5.9 2019 Economic and Fiscal Update 5.7 5.8 5.8 5.8 2020 Economic and Fiscal Snapshot 5.7 7.8 8.8
Step by Step Solution
There are 3 Steps involved in it

Get step-by-step solutions from verified subject matter experts