

Question: Answer the following questions using the data given. Flossing Sex Floss AddedSugar LogAddedSugar Female Neutral 26 1.415 Female Neutral 62 1.792 Female Neutral 17 1.23
Answer the following questions using the data given.
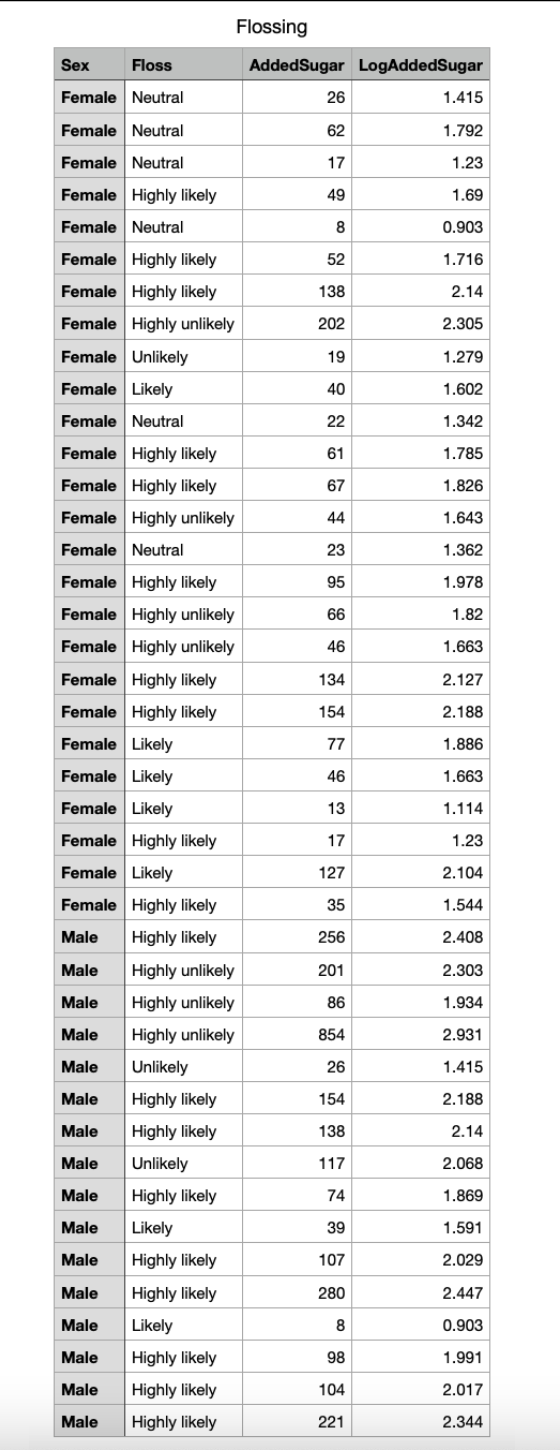
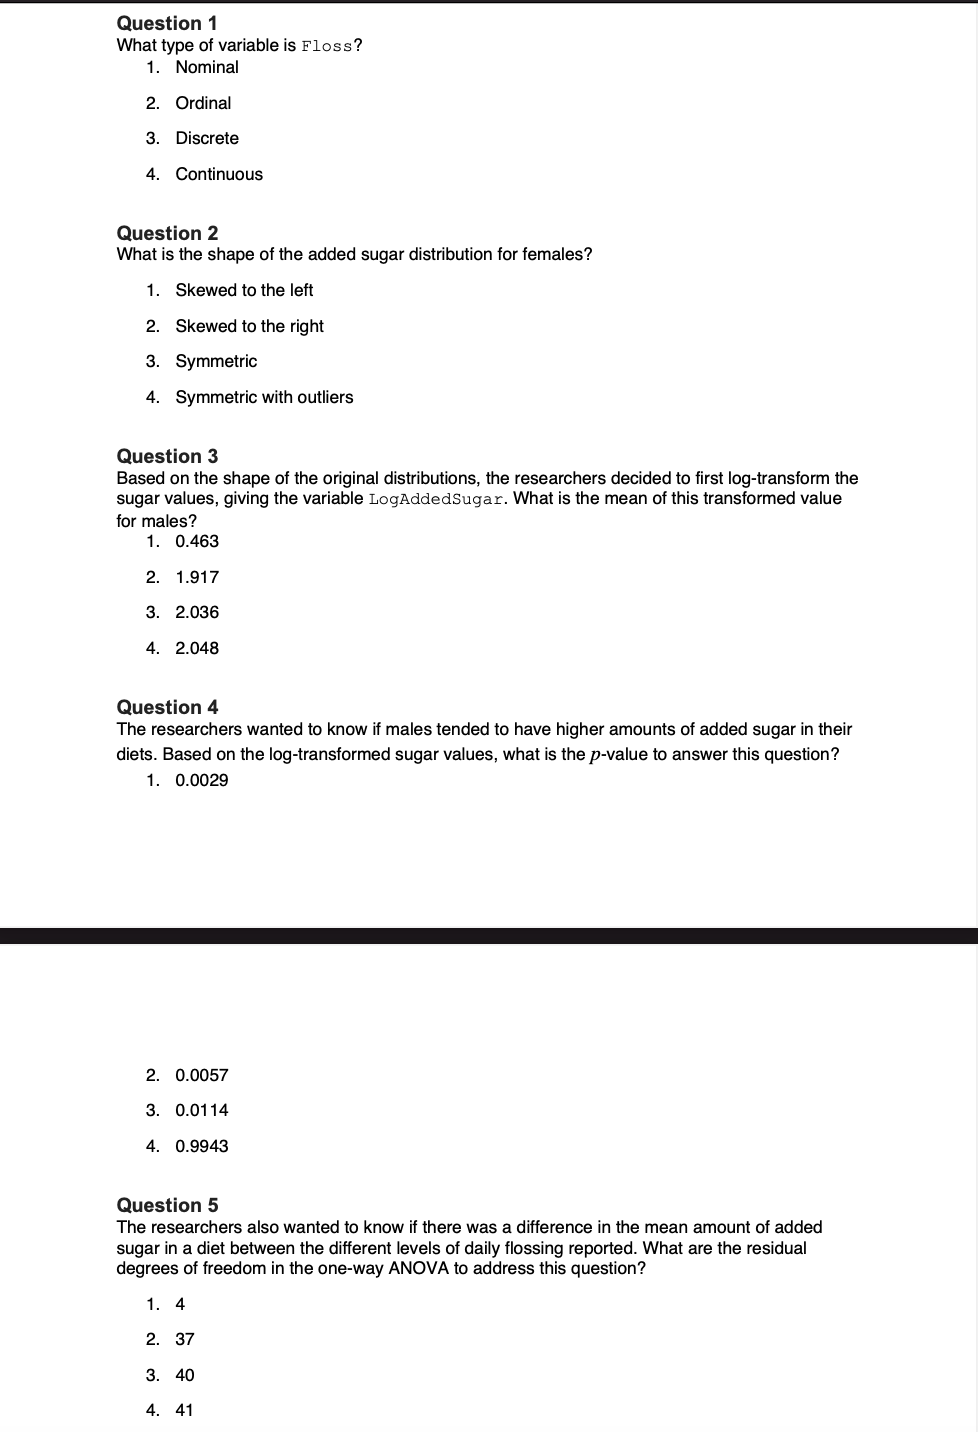
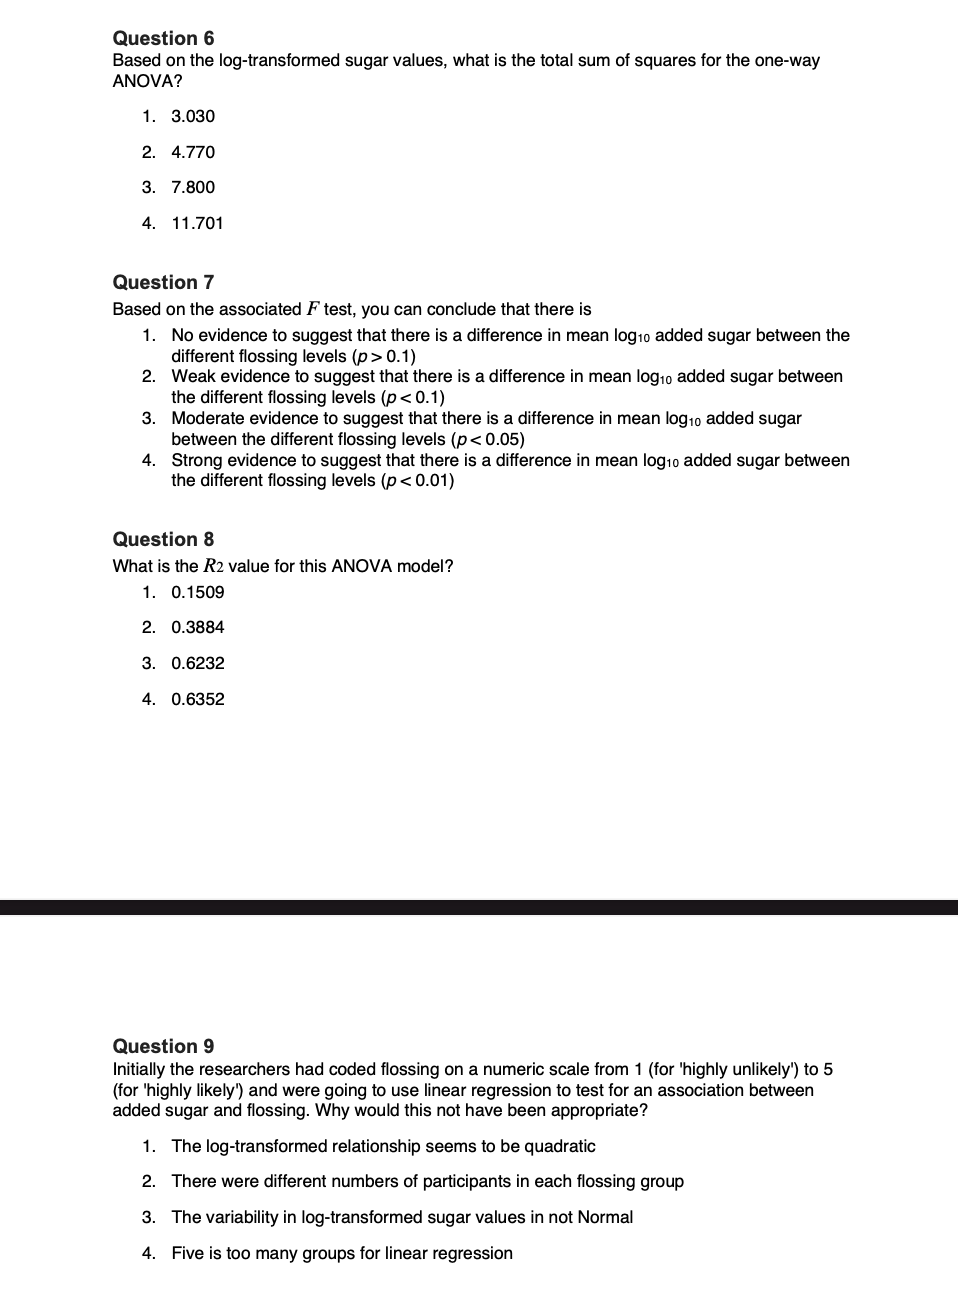
Flossing Sex Floss AddedSugar LogAddedSugar Female Neutral 26 1.415 Female Neutral 62 1.792 Female Neutral 17 1.23 Female Highly likely 49 1.69 Female Neutral 8 0.903 Female Highly likely 52 1.716 Female Highly likely 138 2.14 Female Highly unlikely 202 2.305 Female |Unlikely 19 1.279 Female Likely 40 1.602 Female Neutral 22 1.342 Female Highly likely 61 1.785 Female Highly likely 67 1.826 Female Highly unlikely 44 1.643 Female Neutral 23 1.362 Female Highly likely 95 1.978 Female Highly unlikely 66 1.82 Female |Highly unlikely 46 1.663 Female |Highly likely 134 2.127 Female Highly likely 154 2.188 Female Likely 77 1.886 Female Likely 46 1.663 Female Likely 13 1.114 Female |Highly likely 17 1.23 Female Likely 127 2.104 Female Highly likely 35 1.544 Male Highly likely 256 2.408 Male Highly unlikely 201 2.303 Male Highly unlikely 86 1.934 Male Highly unlikely 854 2.931 Male Unlikely 26 1.415 Male Highly likely 154 2.188 Male Highly likely 138 2.14 Male Unlikely 117 2.068 Male Highly likely 74 1.869 Male Likely 39 1.591 Male Highly likely 107 2.029 Male Highly likely 280 2.447 Male Likely 8 0.903 Male Highly likely 98 1.991 Male Highly likely 104 2.017 Male Highly likely 221 2.344Question 1 What type of variable is Floss ? 1. Nominal 2 Ordinal 3. Discrete 4 Continuous Question 2 What is the shape of the added sugar distribution for females? 1. Skewed to the left 2. Skewed to the right 3. Symmetric 4. Symmetric with outliers Question 3 Based on the shape of the original distributions, the researchers decided to first log-transform the sugar values. giving the variable LogAddedSugar. What is the mean of this transformed value for males? 1. 0.463 2. 1 .91 7 3. 2.036 4. 2.048 Question 4 The researchers wanted to know if males tended to have higher amounts of added sugar in their diets. Based on the log-transformed sugar values. what is the pvalue to answer this question? 1. 0.0029 2. 0.0057 3. 0.01 14 4. 0.9943 Question 5 The researchers also wanted to know if there was a difference in the mean amount of added sugar in a diet between the different levels of daily flossing reported. What are the residual degrees of freedom in the oneway ANOVA to address this question? 1. 4 2. 37 3. 4o 4. 41 Question 6 Based on the log-transformed sugar values, what is the total sum of squares for the one-way ANOVA? 1. 3.030 2. 4.770 3. 7.800 4. 11.701 Question 7 Based on the associated F test, you can conclude that there is 1. No evidence to suggest that there is a difference in mean log10 added sugar between the different flossing levels (p > 0.1) . Weak evidence to suggest that there is a difference in mean log10 added sugar between the different flossing levels (p
Step by Step Solution
There are 3 Steps involved in it

Get step-by-step solutions from verified subject matter experts