

Question: Answer the following two cases: CASE 1: All the questions in this case are related, you may use data from one question within the case,
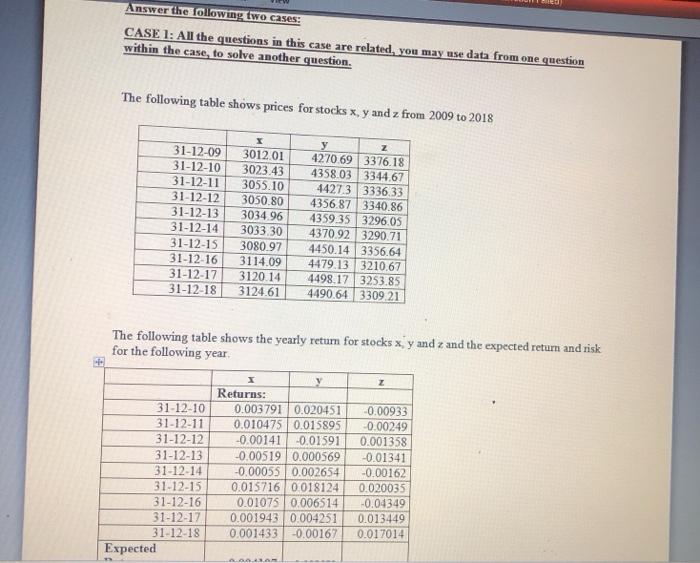
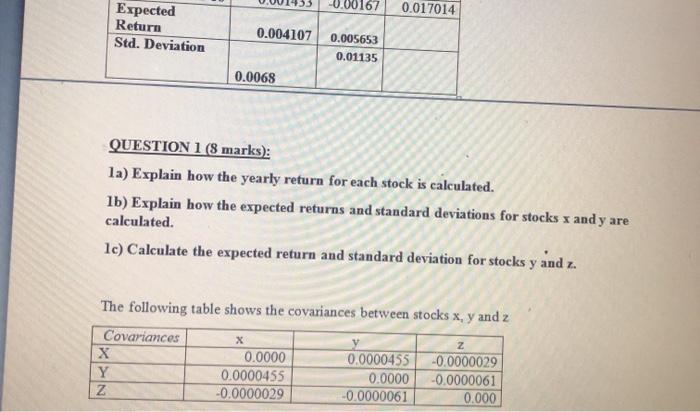
Answer the following two cases: CASE 1: All the questions in this case are related, you may use data from one question within the case, to solve another question. The following table shows prices for stocks x, y and z from 2009 to 2018 31-12-09 31-12-10 31-12-11 31-12-12 31-12-13 31-12-14 31-12-15 31-12-16 31-12-17 31-12-18 3012 01 3023.43 3055.10 3050.80 3034 96 3033.30 3080.97 3114.09 3120.14 3124.61 y Z 4270 69 3376.18 4358.03 3344,67 4427.3 3336 33 4356.87 3340.86 4359 35 3296.05 4370.92 3290.71 4450.14 3356.64 4479.13 321067 4498.17 3253.85 4490.643309 21 The following table shows the yearly return for stocks x,y and z and the expected return and risk for the following year 31-12-10 31-12-11 31-12-12 31-12-13 31-12-14 31-12-15 31-12-16 31-12-17 31-12-18 Expected Returns: 0.003791 0.020451 0.010475 0.015895 -0.00141 -0.01591 -0.00519 0.000569 -0.00055 0.002654 0.015716 0.018124 0.01075 0.006514 0.001943 0.004251 0.001433 -0.00167 -0.00933 -0.00249 0.001358 -0.01341 -0.00162 0.020035 -0.04349 0.013449 0.017014 AAN 0.017014 Expected Return Std. Deviation 0.004107 0.005653 0.01135 0.0068 QUESTION 1 (8 marks): 1a) Explain how the yearly return for each stock is calculated. 1b) Explain how the expected returns and standard deviations for stocks x andy are calculated. le) Calculate the expected return and standard deviation for stocks y and z. The following table shows the covariances between stocks x, y and z Covariances 0.0000 0.0000455 -0.0000029 Y 0.0000455 0.0000 -0.0000061 Z -0.0000029 -0.0000061 0.000 Z
Step by Step Solution
There are 3 Steps involved in it

Get step-by-step solutions from verified subject matter experts