

Question: Answer the question from the image above with the worked solution The following is a cumulative frequency diagram for the time , in minutes, taken
Answer the question from the image above with the worked solution
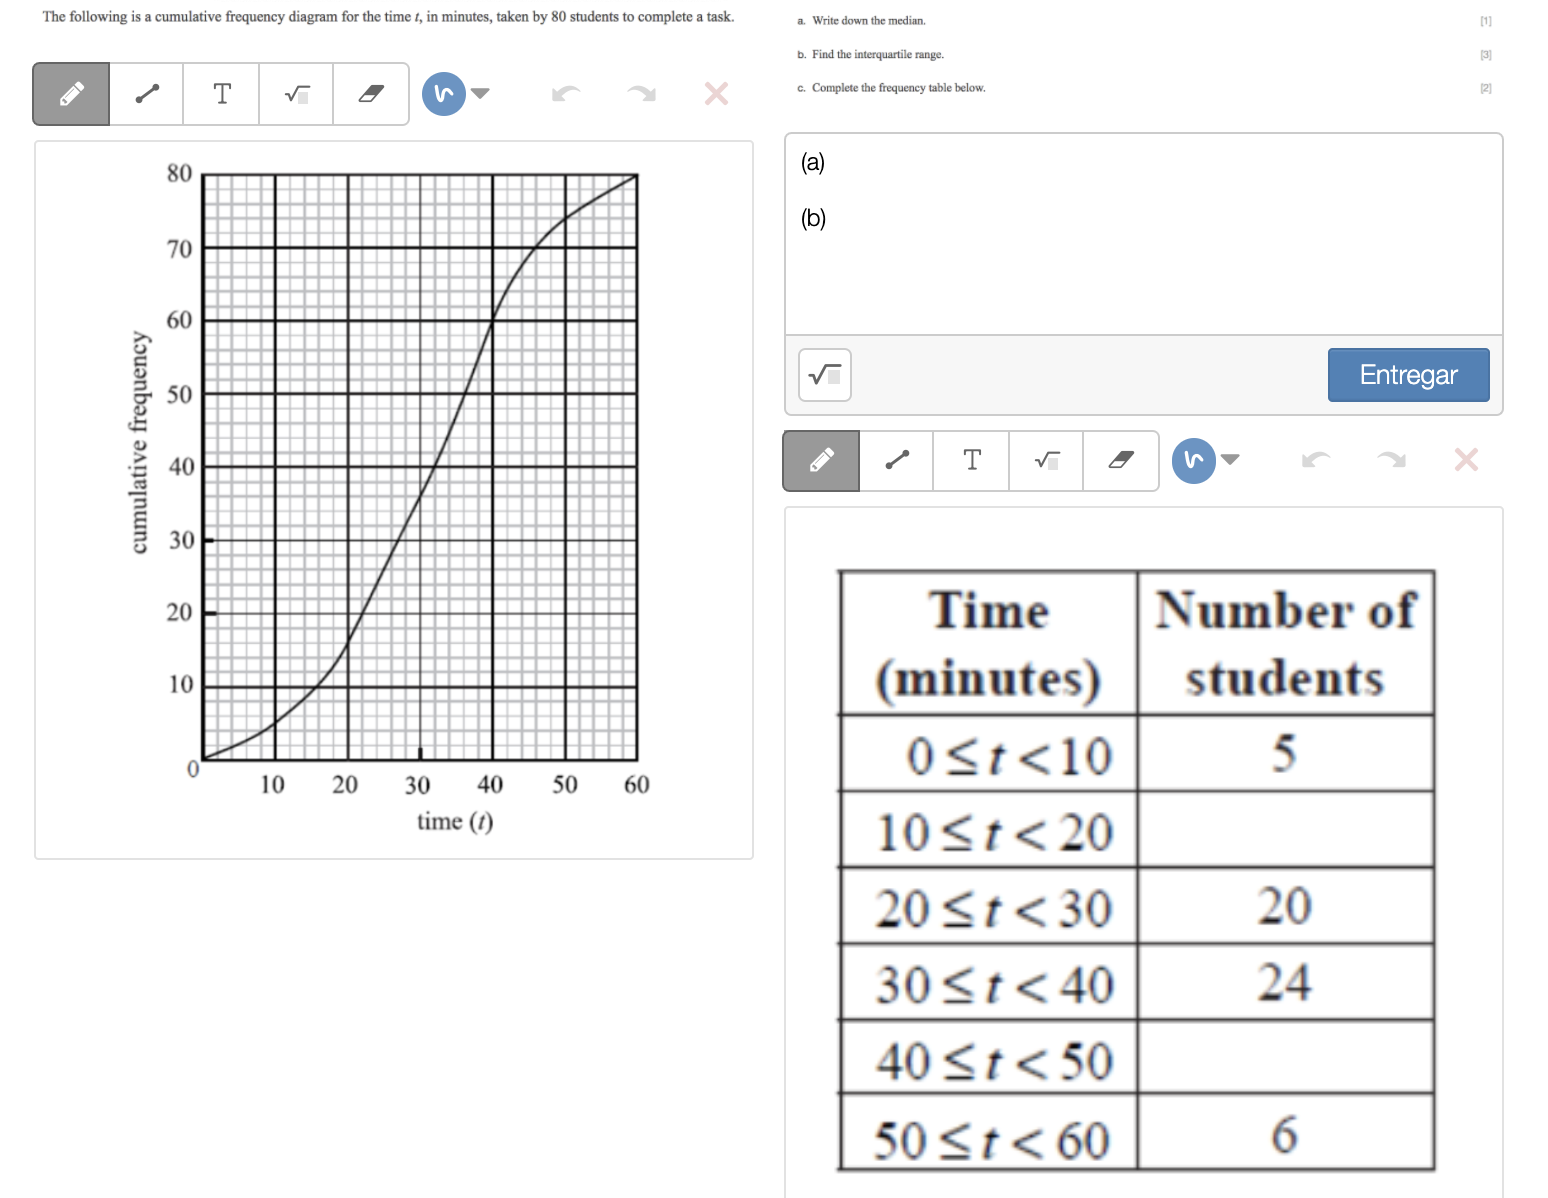
The following is a cumulative frequency diagram for the time , in minutes, taken by 80 students to complete a task. . Write down the median. [1] b. Find the interquartile range. (3] T V ~ X c. Complete the frequency table below. (21 80 (a) (b) 70 60 50 Entregar cumulative frequency 40 T X 30 20 Time Number of 10 (minutes) students 10 20 30 40 50 Ost
Step by Step Solution
There are 3 Steps involved in it
1 Expert Approved Answer
Step: 1 Unlock

Question Has Been Solved by an Expert!
Get step-by-step solutions from verified subject matter experts
Step: 2 Unlock
Step: 3 Unlock