

Question: Answer the question: How will GM companys financial position relate to its future direction and development? (At least three full paragraphs). AutoSaver NA2 Home Insert
Answer the question: How will GM companys financial position relate to its future direction and development? (At least three full paragraphs).
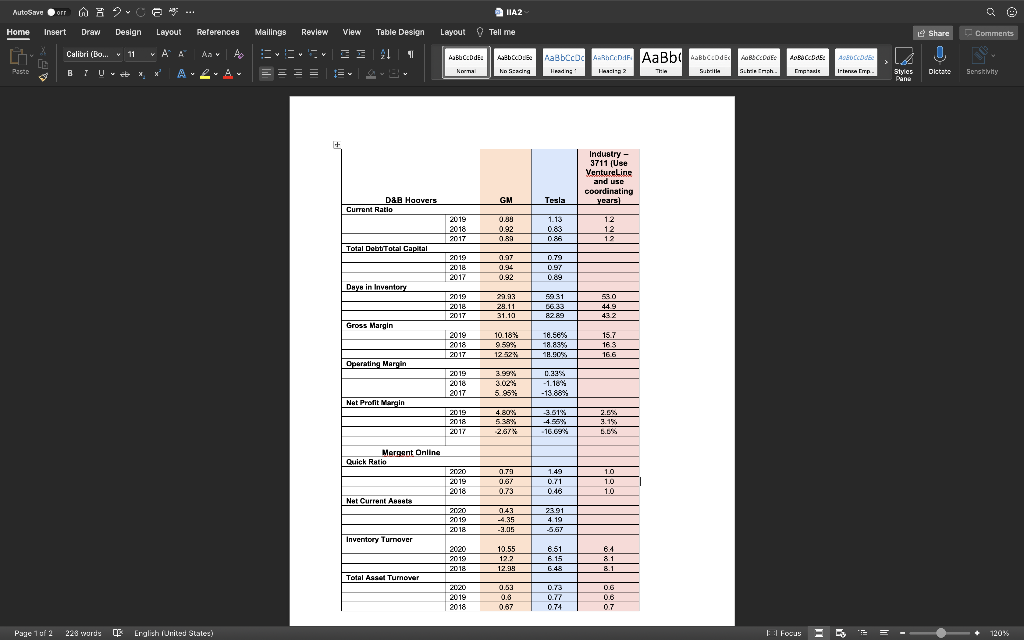
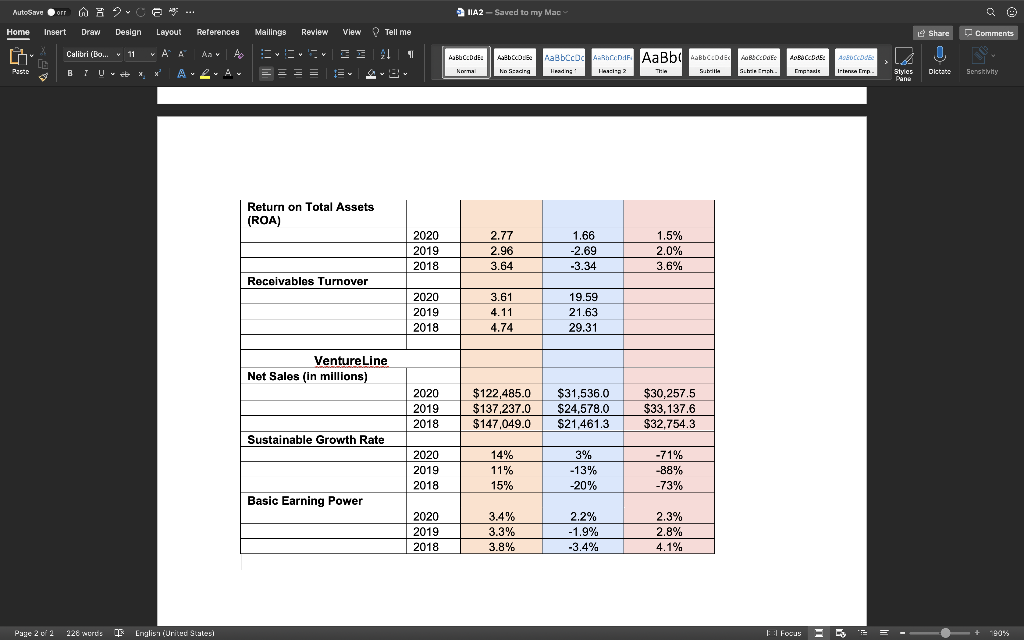
AutoSaver NA2 Home Insert Draw Design Layout References Mailings Review View Table Design Layout Tell me Share Comments 2 A CAL 11 ABECEDDE: . Calitri (Eo... v 11 B1 Uit X AaBb COCARDIF AaBbc BBCode RCDF ABOCCASABO TER Trip NTHA * Indra A ?l:11 Sabril TH E Sinch Styles Pane Dictate Sensity Industry - 3711 (Use VentureLing and use coordinating years D&B Haavers Current Ratio GM Tesla 0.89 2019 2018 2017 1.13 0.83 12 12 12 OMA Total Debt Total Capital 2019 2018 2017 0.97 0.94 0.92 0.79 0.97 Days in Inventory 2019 2015 2017 29.33 29.11 31.10 550 31 56.33 82.89 530 44 432 Gross Margin 2019 2018 2010 2017 10.18% 9 59% 12:23 18.56% 18.885 18.00 15.7 16 S 166 Operating Margin 2019 2018 2017 3.02% -1.18% -13 88% Net Profit Margin 2.5% 2019 2018 2017 4.80% 5.38% 2.67% 3.51% -4.567. -16.09% L.BA Mergent Online Quick Ratio 0.79 2020 2019 2018 1.49 0.71 0.48 10 1.0 10 0.73 Net Current Asseta 2020 2019 2018 0.43 -4.35 -3.05 2391 4 19 -5.67 Inventory Turnover 2020 2019 10.55 12.2 12.98 6.51 6.15 6.48 8.1 Total Asset Turnover 2020 2019 2018 0.53 0.8 0.87 0.73 0.77 0.74 06 06 0.7 Page 1 of 2 228 wurde Erglish (United States) T:: Focus E = - + 120% AutoSaver HA2-Saved to my Mac e Home Insert Draw Design Layout References Mallings Review View Tell me Share Comments Calitri (Bo.. v 11 AL 11 ABCDE : 4abc AaBbcod RDAR AaBb Bbc Ode ORICEDOF: ABCD TA Accade Irenn B T X NOT Sabril AB X hn Serg == 7 ?Tha - l Styles Pane Dictate Sensilly Return on Total Assets (ROA) 2020 2019 2018 2.77 2.96 3.64 1.66 -2.69 -3.34 1.5% 2.0% 3.6% Receivables Turnover 2020 2019 2018 3.61 4.11 4.74 19.59 21.63 29.31 Venture Line Net Sales (in millions) 2020 2019 2018 $122,485.0 $137.237.0 $147,049.0 $31,536.0 $24,578.0 $21,461.3 $30,257.5 $33, 137.6 $32,754.3 Sustainable Growth Rate 2020 2019 2018 14% 11% 15% 3% -13% -20% -71% -88% -73% Basic Earning Power 2020 2019 2018 3.4% 3.3% 3.8% 2.2% -1.9% -3.4% 2.3% 2.8% 4.1% Page 202 228 wurus English United States 1: : Focus -20%
Step by Step Solution
There are 3 Steps involved in it

Get step-by-step solutions from verified subject matter experts