

Question: Answer the question in the screenshot below. Please write legibly and show your work. Thank you! 2. The foldwing data represent scores of 32 on

Answer the question in the screenshot below. Please write legibly and show your work. Thank you!
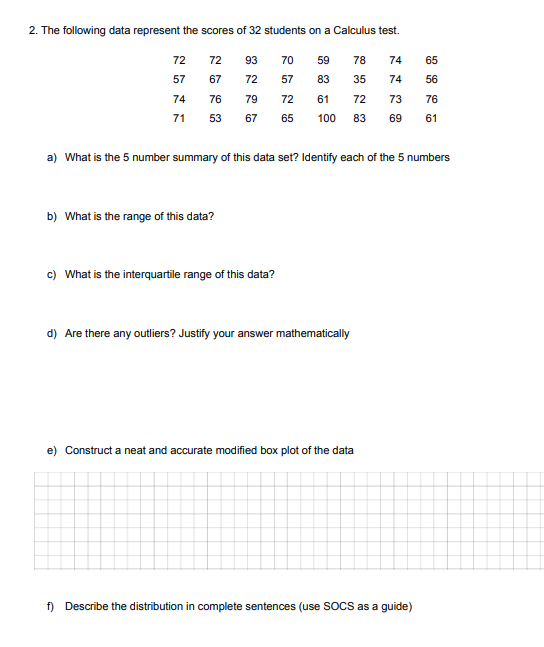
2. The foldwing data represent scores of 32 on a test. 57 71 72 67 76 53 93 72 79 67 70 57 72 59 83 100 35 83 74 74 73 65 56 76 a) What is the S number summary of this data set? Identify each of the 5 numbers b) What is the of this data? c) What is the interquartde range of this data? d) Are there any outliers? Justify your answer mathematicalty e) Construct a neat and accurate modified box plot of the data f) Descrbe the distribution in compete sentences SOCS as a gu
Step by Step Solution
There are 3 Steps involved in it

Get step-by-step solutions from verified subject matter experts