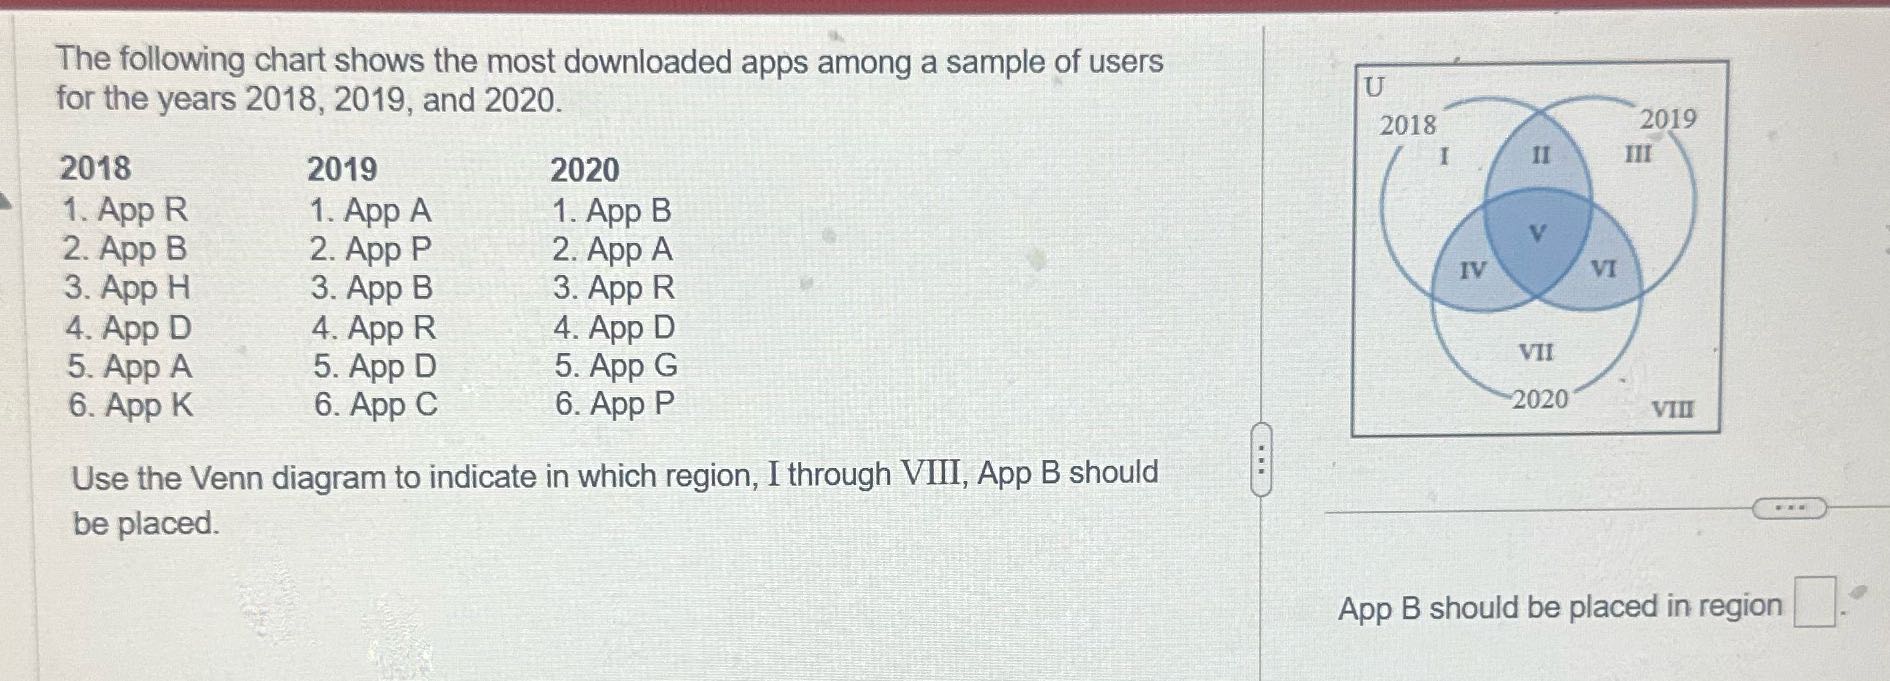
Question: Answer the question The following chart shows the most downloaded apps among a sample of users Tor the years 2018, 2019, and 2020. 2018 2019

Answer the question

Answer the question The following chart shows the
The following chart shows the most downloaded apps among a sample of users Tor the years 2018, 2019, and 2020. 2018 2019 2020 * 4. App R 1. App A 1. App B 2. App B 2. App P 2. App A 3. App H 3. App B 3. App R 4. App D 4. App R 4. App D 5. App A 5. App D 5. App G 6. App K 6. App C 6. App P Use the Venn diagram to indicate in which region, I through VIII, App B should : be placed. App B should be placed in region ie

Step by Step Solution

There are 3 Steps involved in it

1 Expert Approved Answer
Step: 1 Unlock blur-text-image
Question Has Been Solved by an Expert!

Get step-by-step solutions from verified subject matter experts

Step: 2 Unlock
Step: 3 Unlock

Students Have Also Explored These Related Accounting Questions!