

Question: Answer the questions based on the following graph: 12 11 - CALO 10 Stocks 9 8 E(r.) = 7.16% Expected return (%) 7 Portfolio o
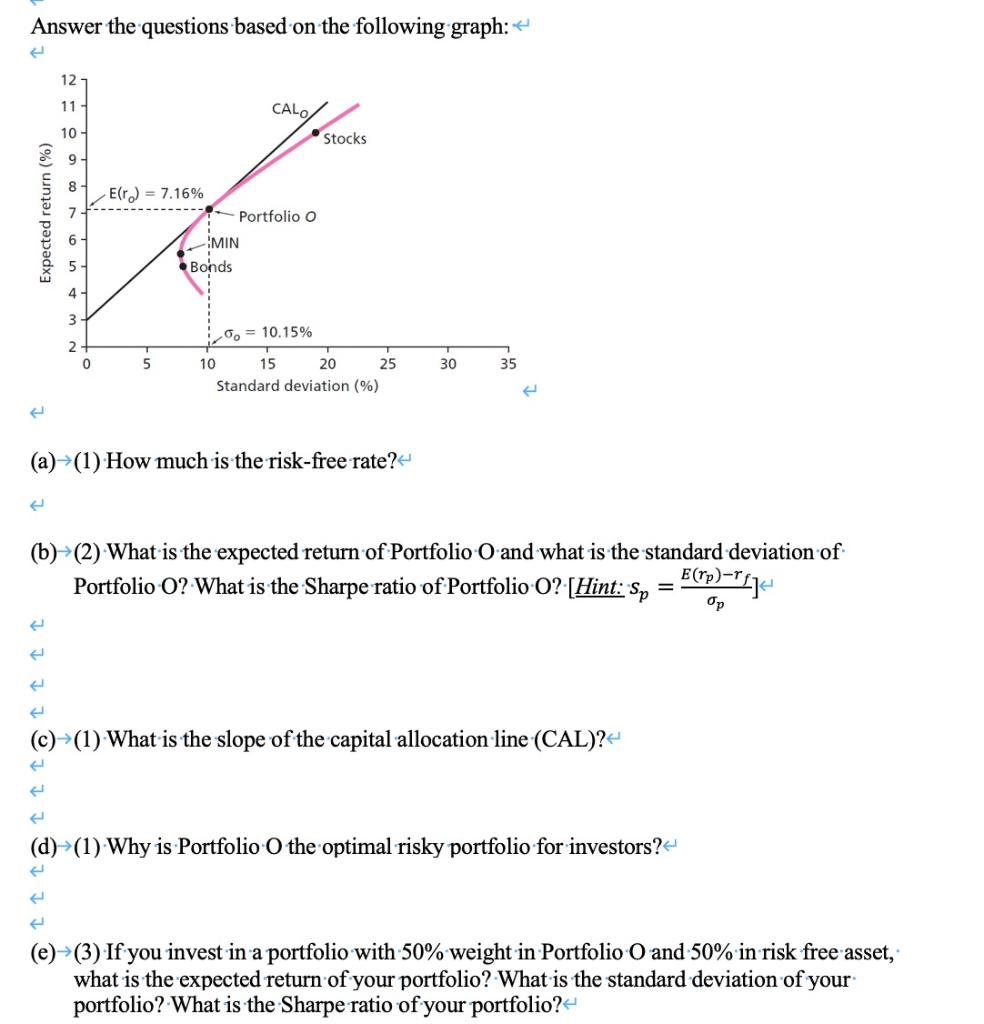
Answer the questions based on the following graph: 12 11 - CALO 10 Stocks 9 8 E(r.) = 7.16% Expected return (%) 7 Portfolio o 6 MIN Bonds 5 4 3 0. = 10.15% 2 0 5 30 35 10 15 20 25 Standard deviation (%) (a)-(1) How much is the risk-free rate? (b)-(2) What is the expected return of Portfolio O and what is the standard deviation of Portfolio-O? What is the Sharpe ratio of Portfolio O? (Hint: Sp = E(rp)="{]- & (c)(1) What is the slope of the capital allocation line (CAL)? (d)-(1) Why is Portfolio O the optimal risky portfolio for investors?" (e)-(3) If you invest in a portfolio with 50% weight in Portfolio O and 50% in risk free asset, what is the expected return of your portfolio? What is the standard deviation of your portfolio? What is the Sharpe ratio of your portfolio
Step by Step Solution
There are 3 Steps involved in it

Get step-by-step solutions from verified subject matter experts