

Question: Answer the questions below by filling in/editing the boxes/chart provided. 1.State the equilibrium price and equilibrium quantity (each to the nearest whole number). 2. Suppose
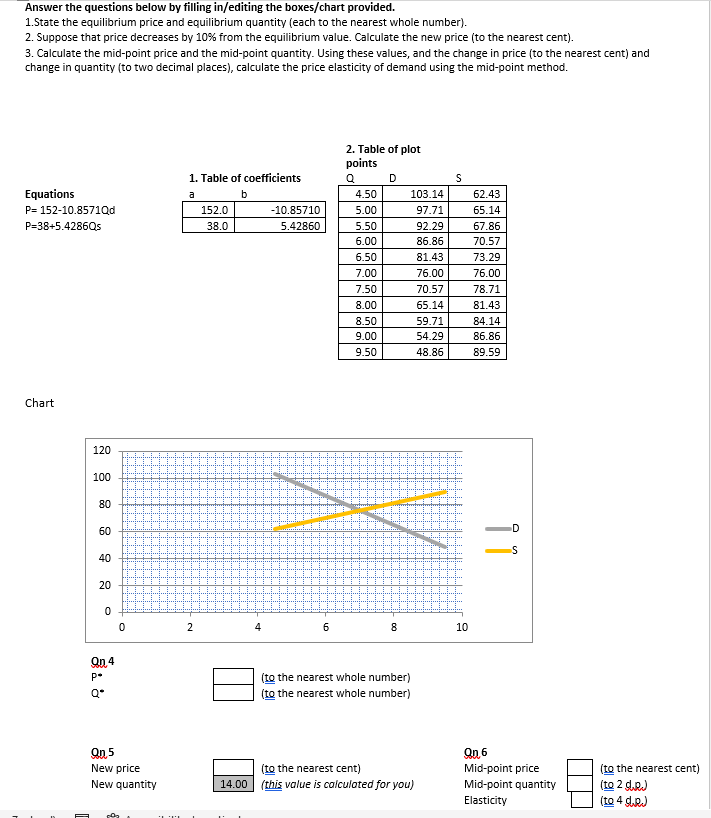
Answer the questions below by filling in/editing the boxes/chart provided. 1.State the equilibrium price and equilibrium quantity (each to the nearest whole number). 2. Suppose that price decreases by 10% from the equilibrium value. Calculate the new price (to the nearest cent). B. Calculate the mid-point price and the mid-point quantity. Using these values, and the change in price (to the nearest cent) and change in quantity (to two decimal places), calculate the price elasticity of demand using the mid-point method 2. Table of plot points 1. Table of coefficients D S Equations a b 4.50 103.14 52.43 P= 152-10.85710d 152.0 -10.85710 5.00 97.71 65.14 P=38+5.42860 38.0 5.42860 5.50 92.29 67.86 6.00 86.86 0.57 5.50 81.43 3.29 7.00 76.00 76.00 7.50 70.57 78.71 8.00 65.14 81.43 8.50 59.71 84.14 9.00 54.29 86.86 9.50 48.86 89.59 Chart 120 100 80 60 40 20 8 10 On 4 (to the nearest whole number) (to the nearest whole number) On 5 On 6 New price (to the nearest cent) Mid-point price (to the nearest cent) New quantity 14.00 (this value is calculated for you) Mid-point quantity (to 2 day Elasticity (to 4 d.R.)
Step by Step Solution
There are 3 Steps involved in it

Get step-by-step solutions from verified subject matter experts