

Question: answer the questions Fitting a straight line to a set of data yields the following prediction line. Complete (a) through (c) below. a = a
answer the questions
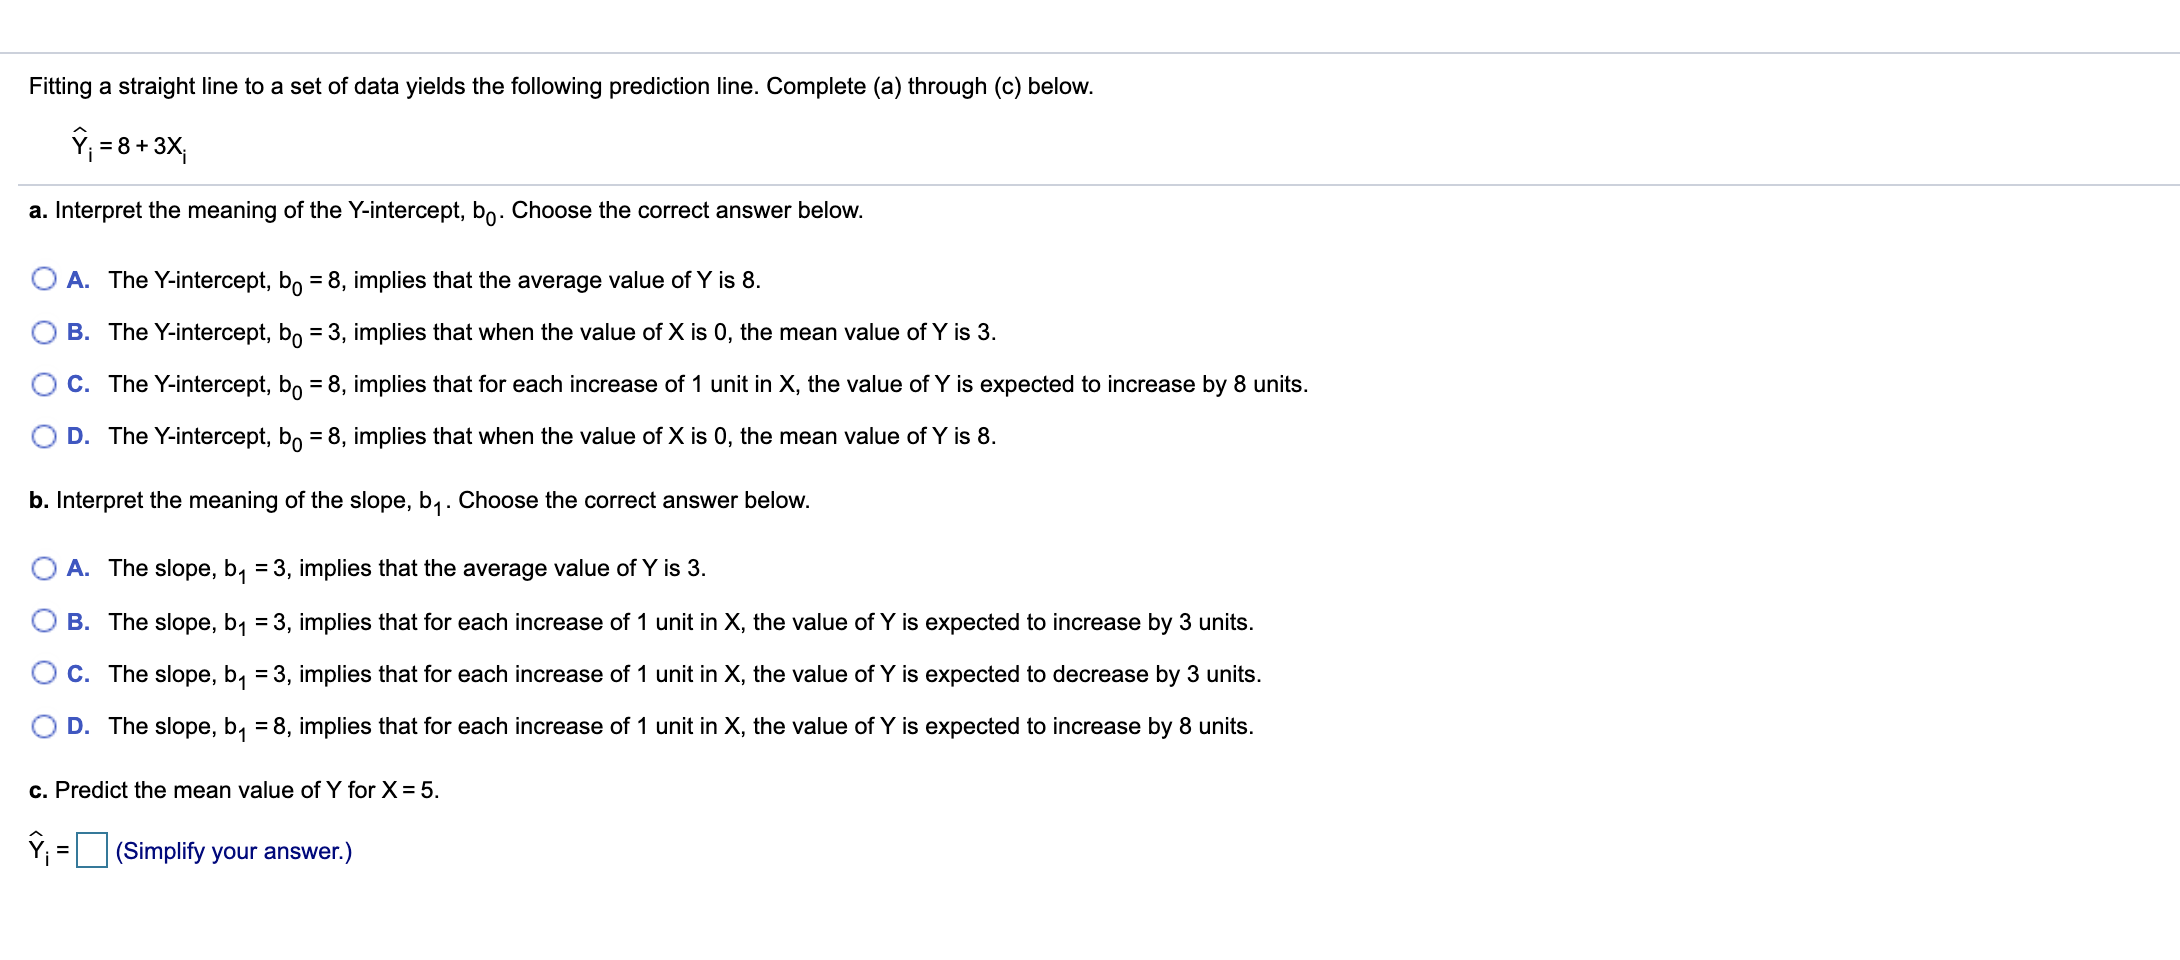
Fitting a straight line to a set of data yields the following prediction line. Complete (a) through (c) below. a = a + 3xi a. Interpret the meaning of the Y-intercept, b0. Choose the correct answer below. 0 A. The Y-intercept, b0 = 8, implies that the average value on is 8. O B. The Y-intercept, b0 = 3, implies that when the value of X is 0, the mean value on is 3. O C. The Y-intercept, b0 = 8, implies that for each increase of 1 unit in X, the value of Y is expected to increase by 8 units. 0 D. The Y-intercept, ho = 8, implies that when the value of X is 0, the mean value on is 8. b. Interpret the meaning of the slope, b1. Choose the correct answer below. 0 A. The slope, b1 = 3, implies that the average value on is 3. O B. The slope, b1 = 3, implies that for each increase of 1 unit in X, the value on is expected to increase by 3 units. 0 C. The slope, b1 = 3, implies that for each increase of 1 unit in X, the value on is expected to decrease by 3 units. 0 D. The slope, b1 = 8, implies that for each increase of 1 unit in X, the value on is expected to increase by 8 units. c. Predict the mean value of Y for X = 5. Xi = (Simplify your answer.)
Step by Step Solution
There are 3 Steps involved in it

Get step-by-step solutions from verified subject matter experts