

Question: Chapter Two, Part 2 Exercises 1. Using the data below, construct three graphs: one showing percentage distributions for race/ethnicity, one showing percentage distributions for
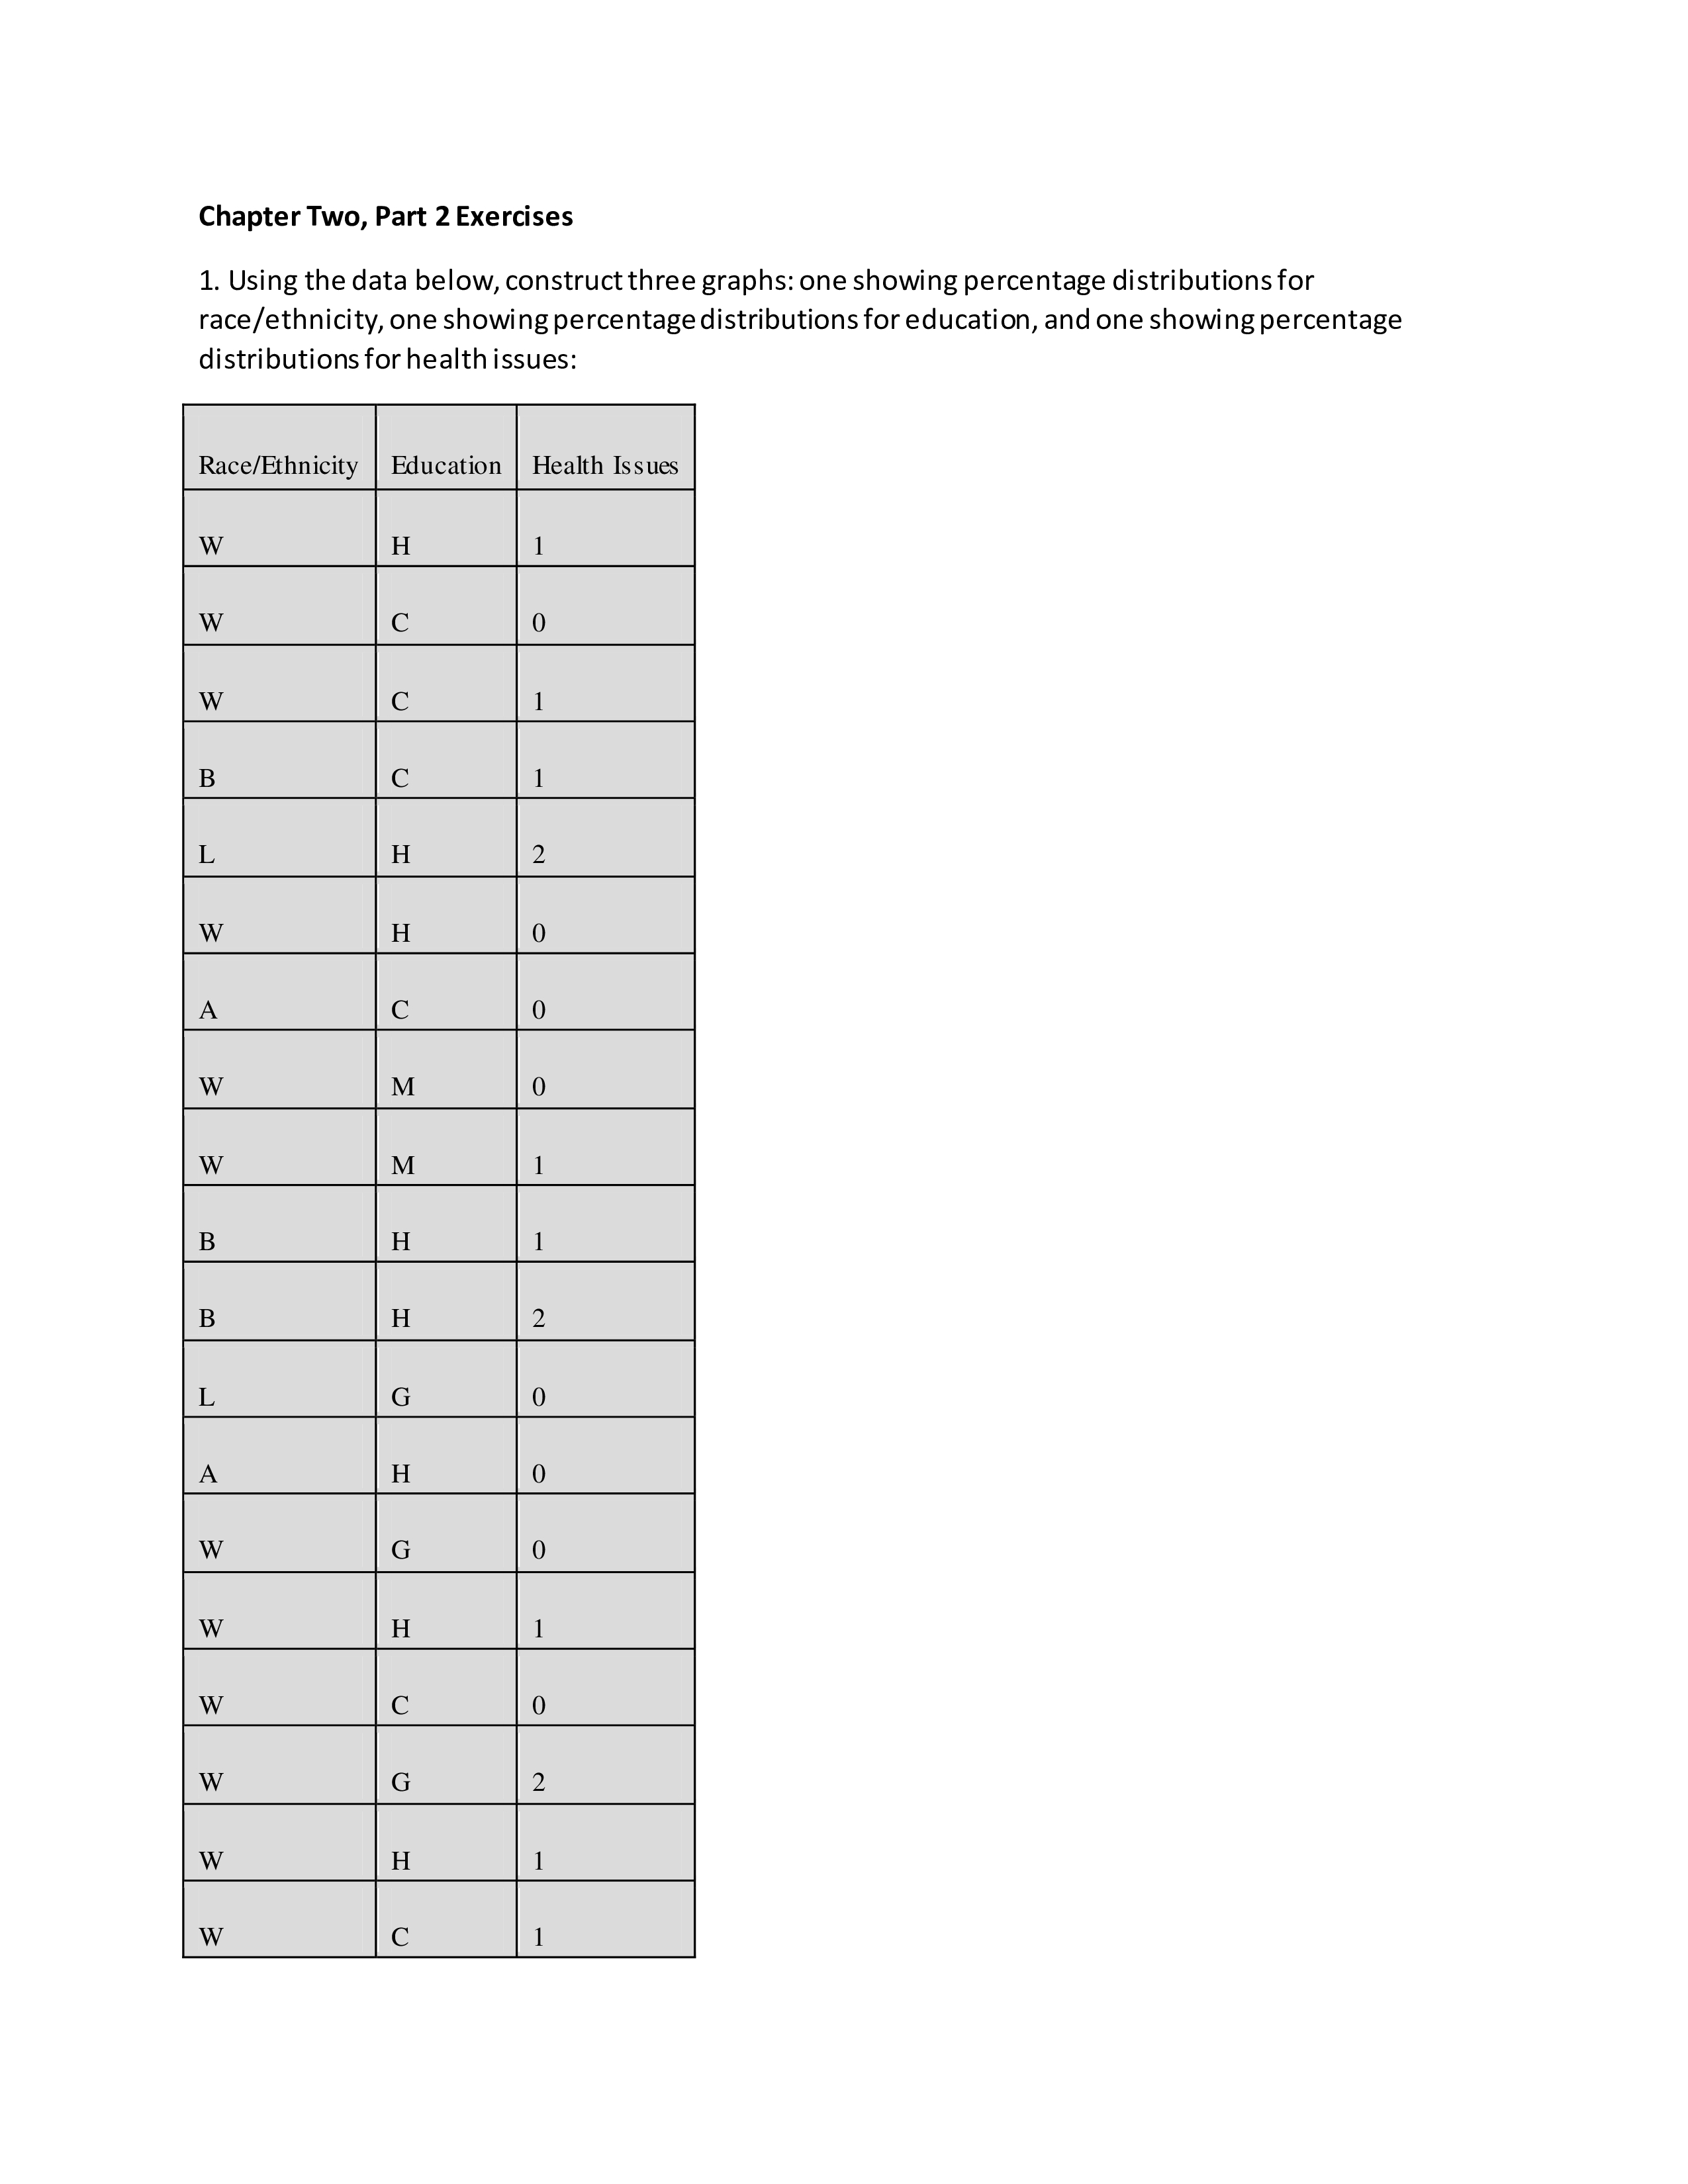
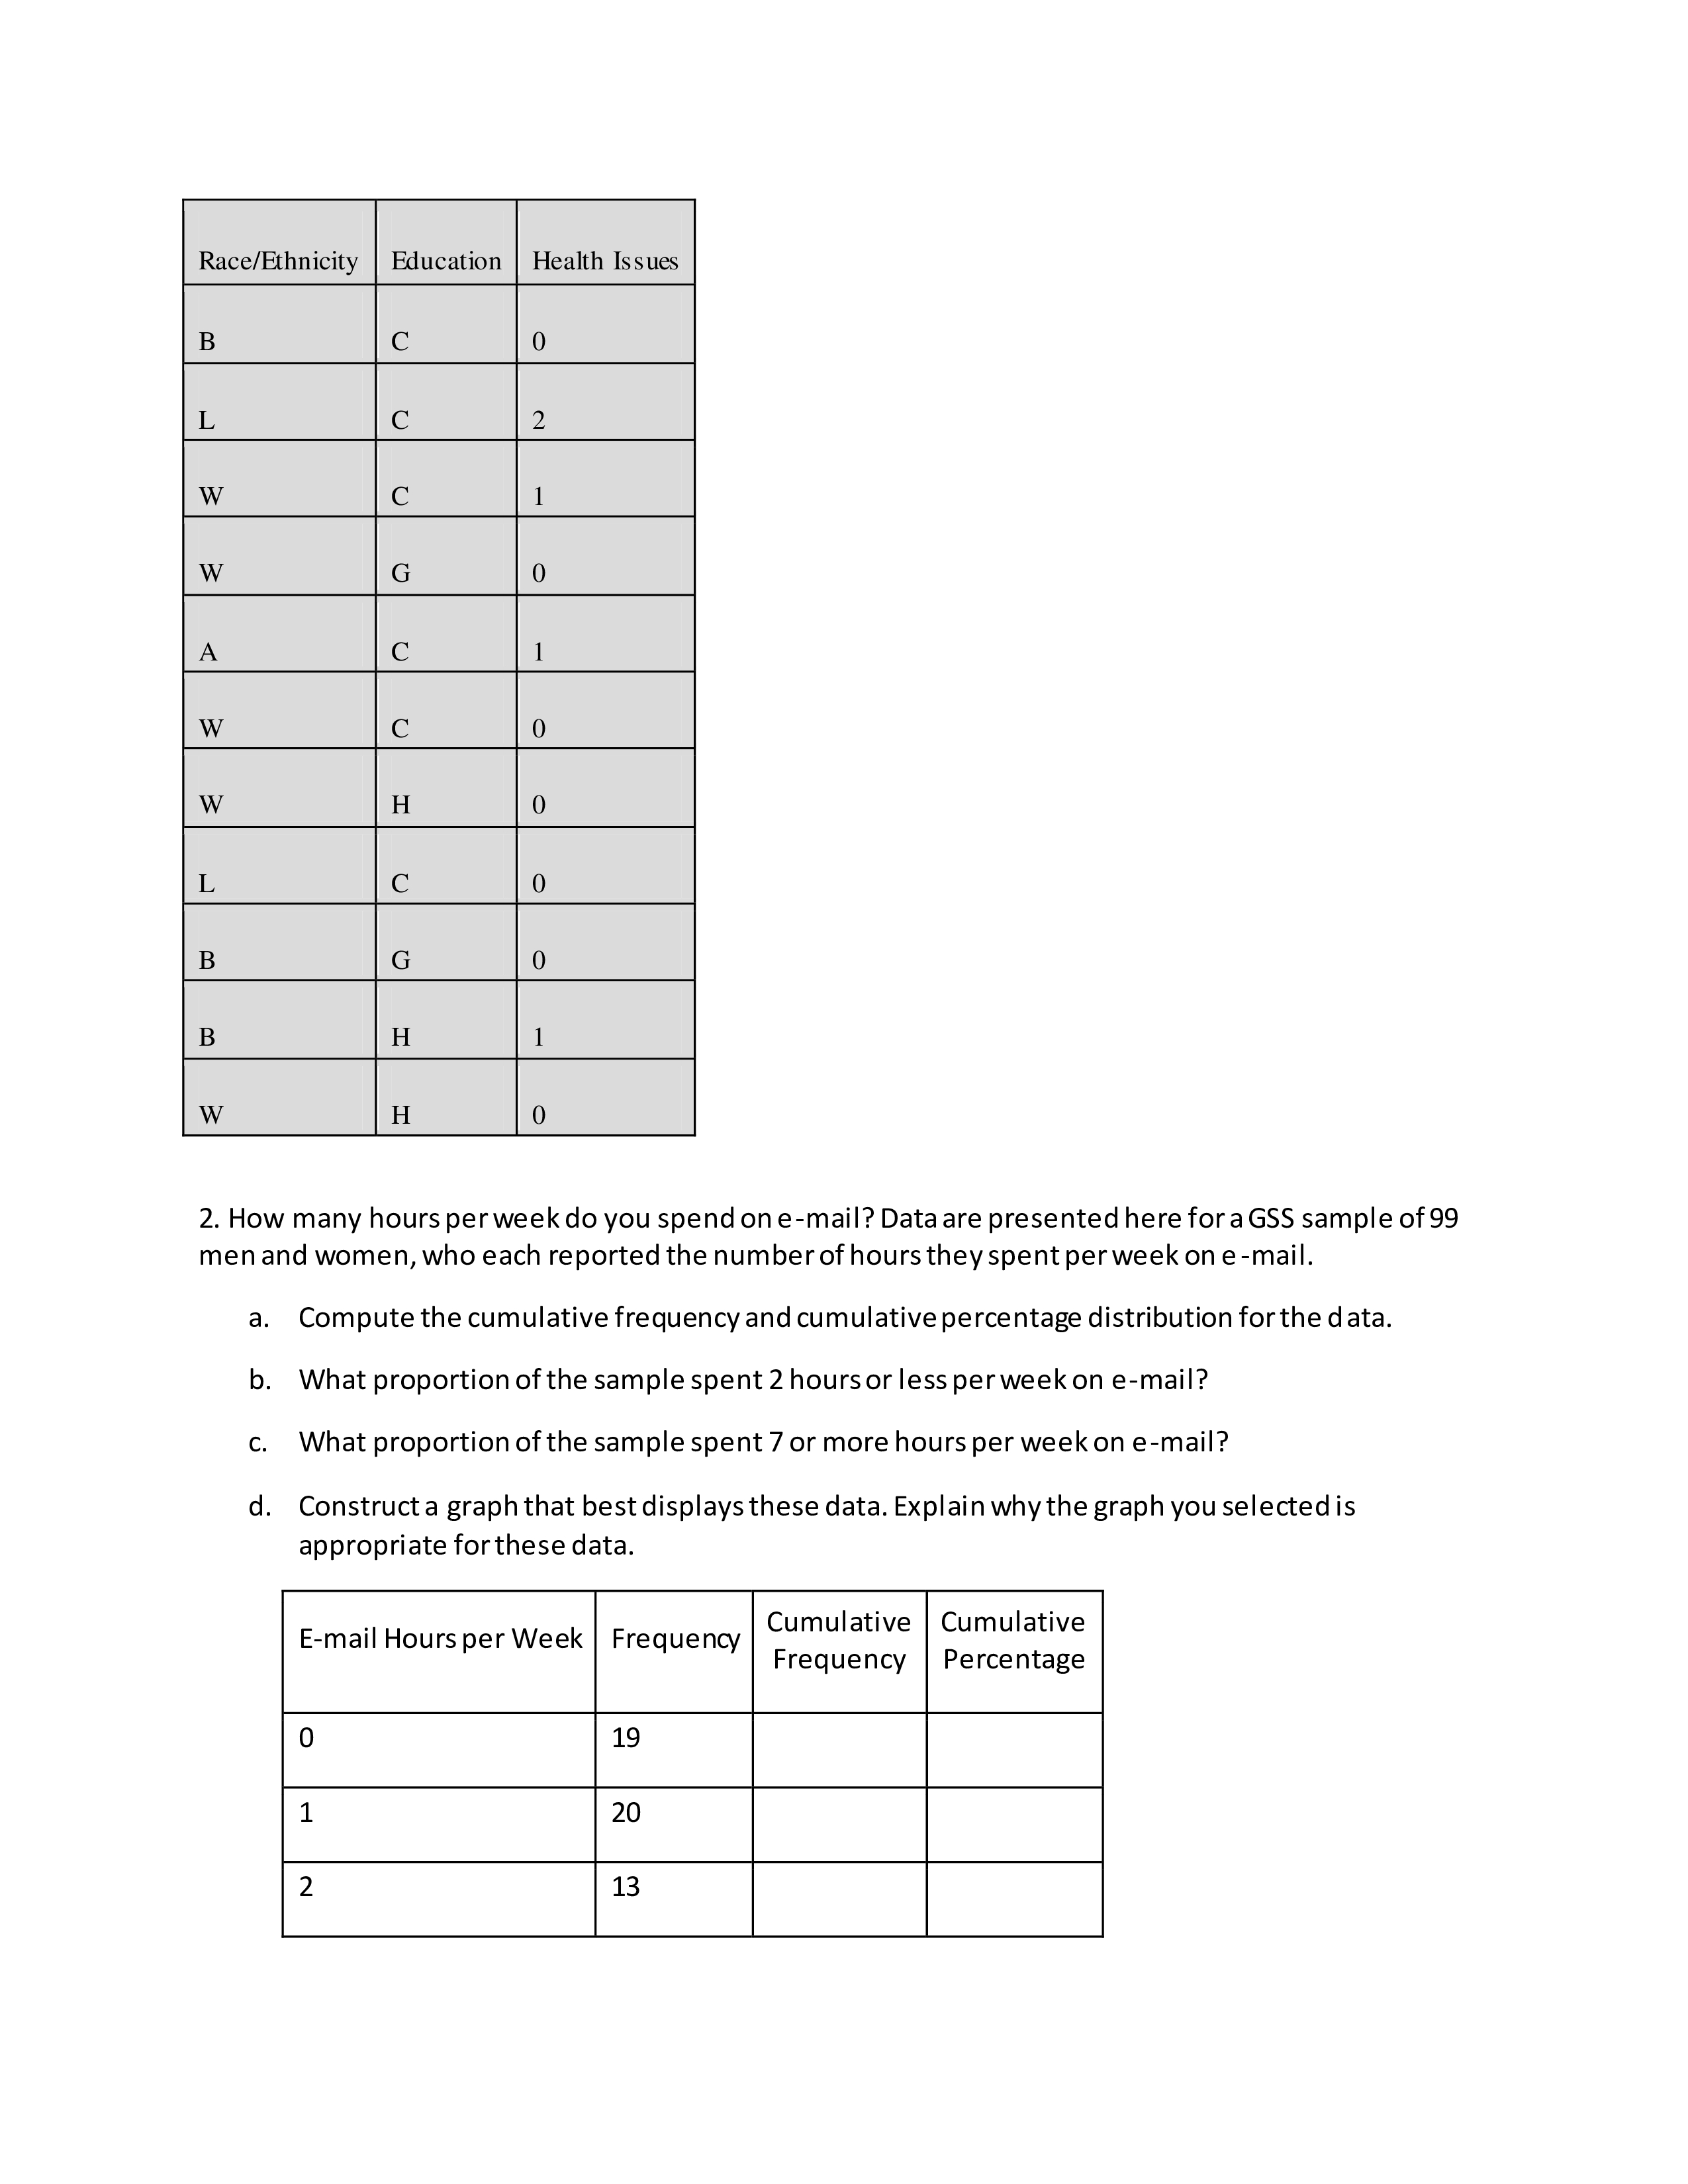
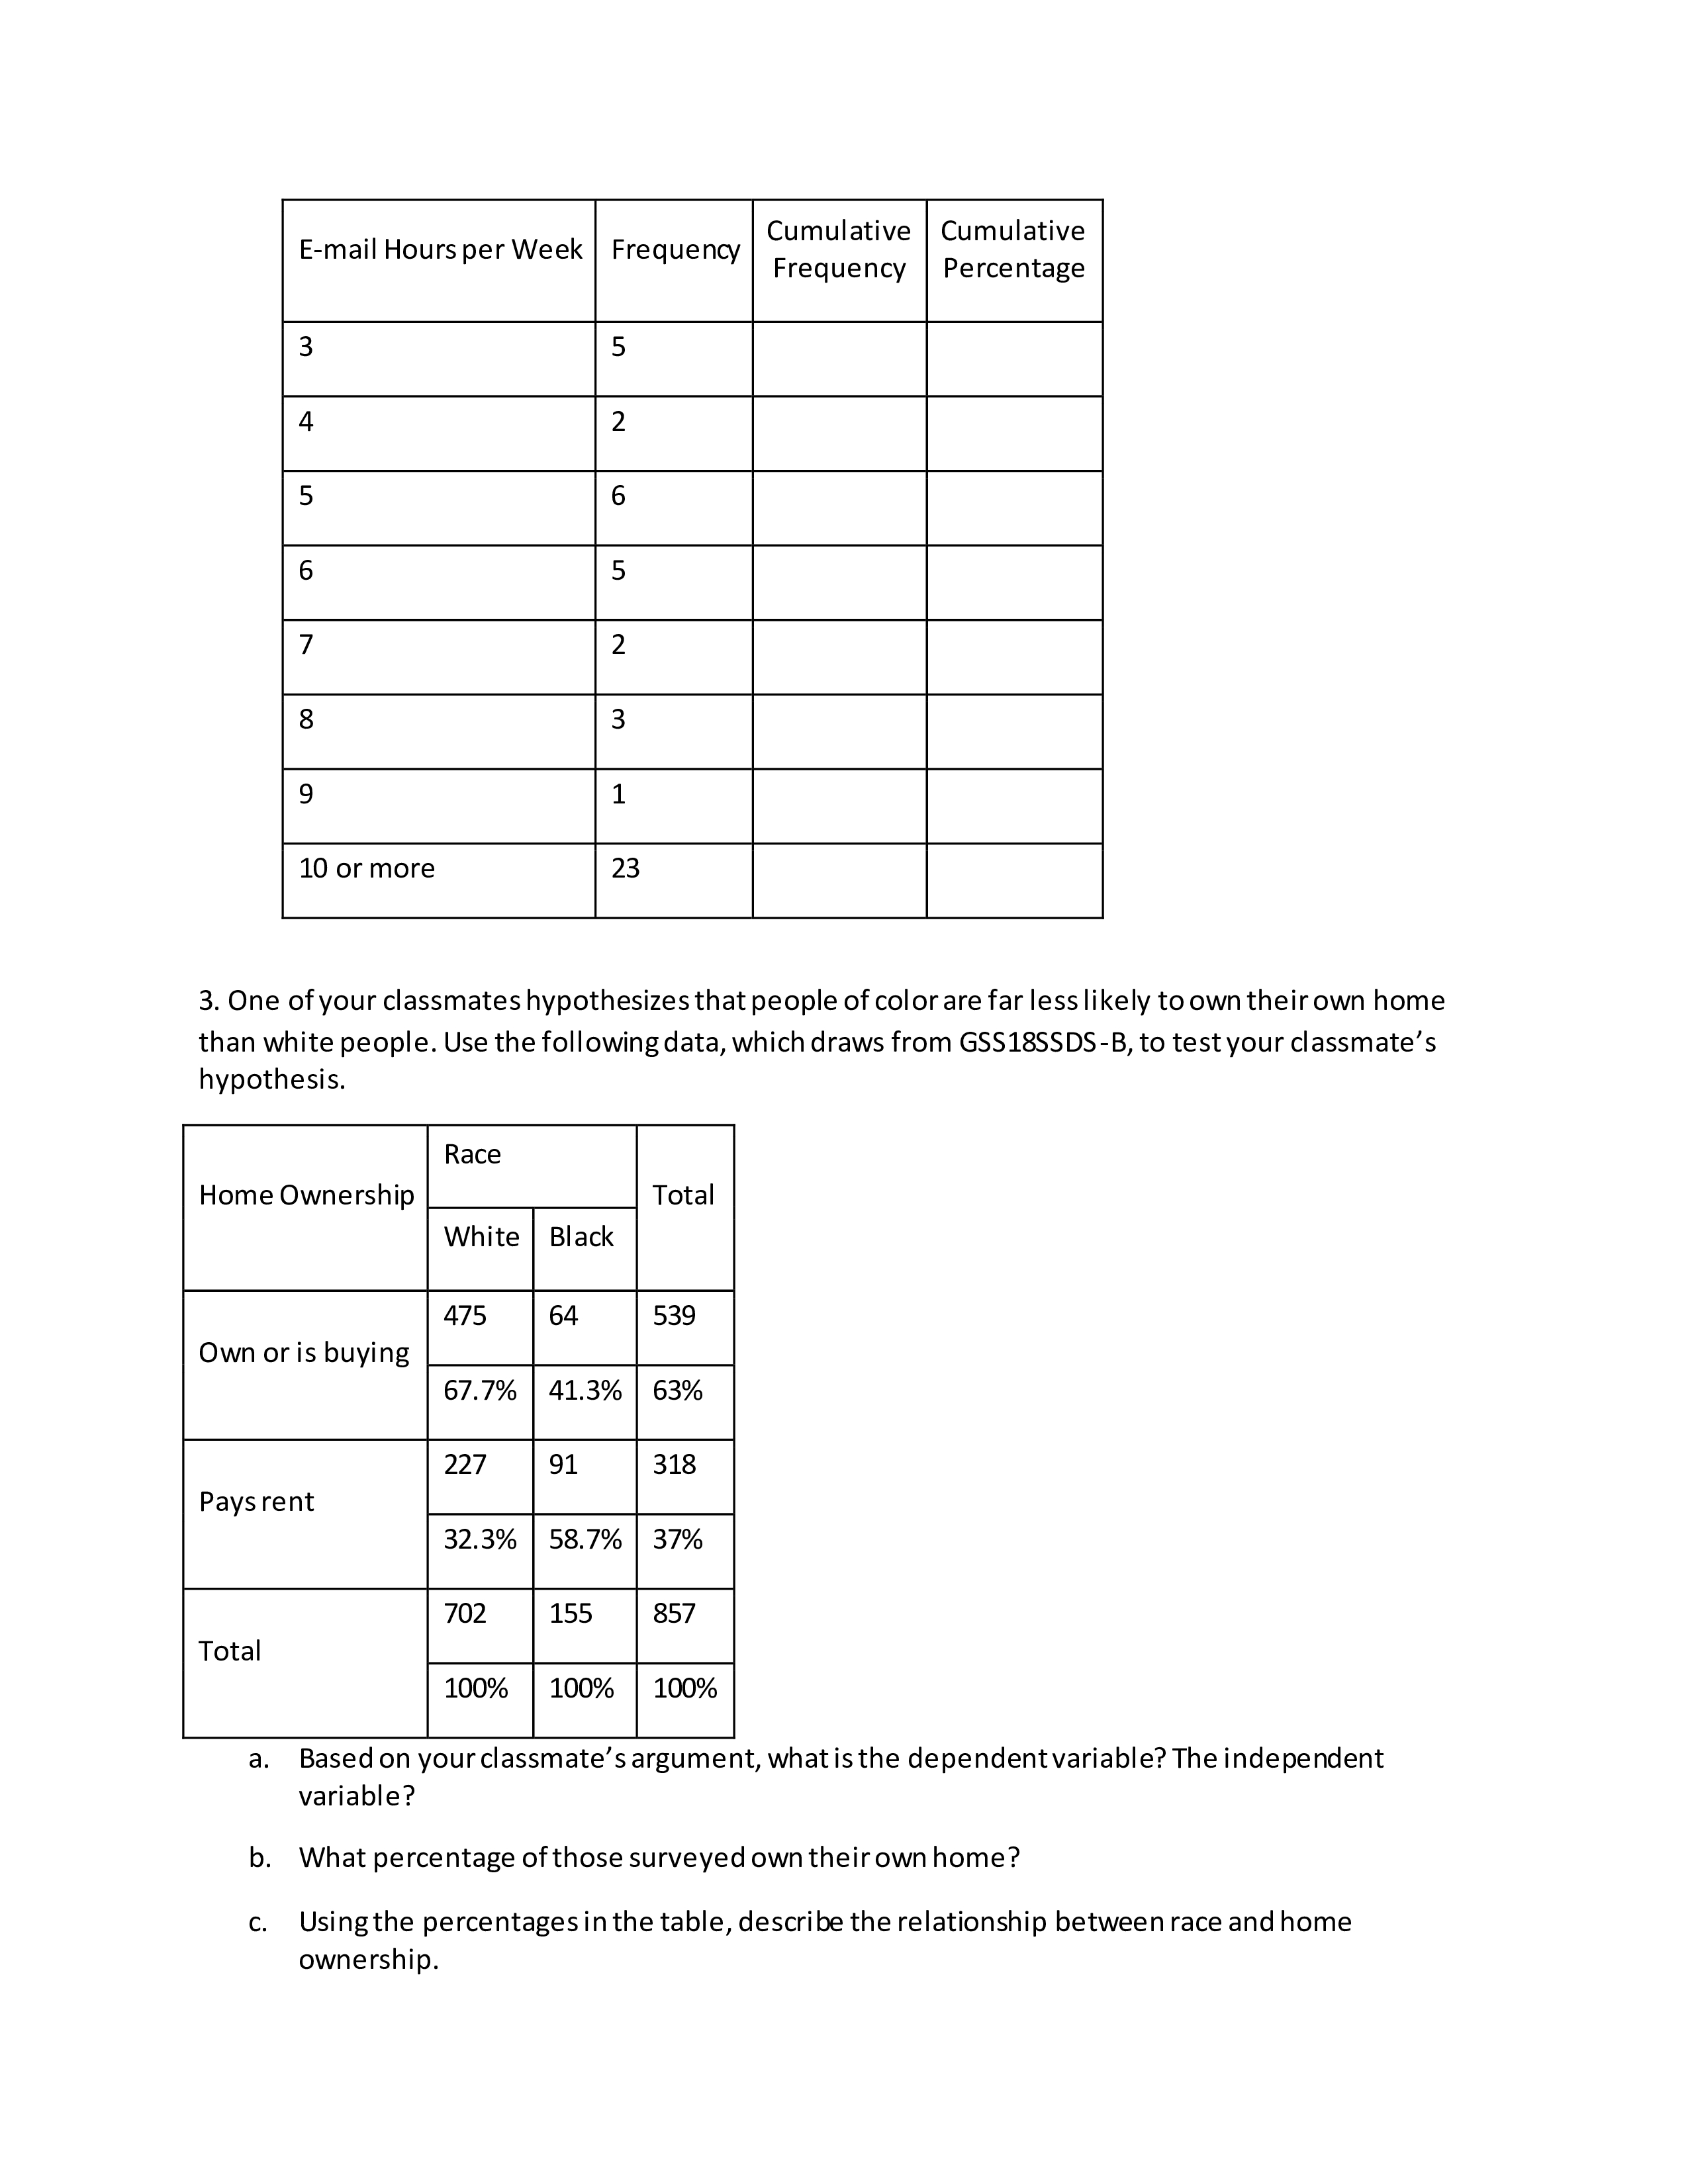
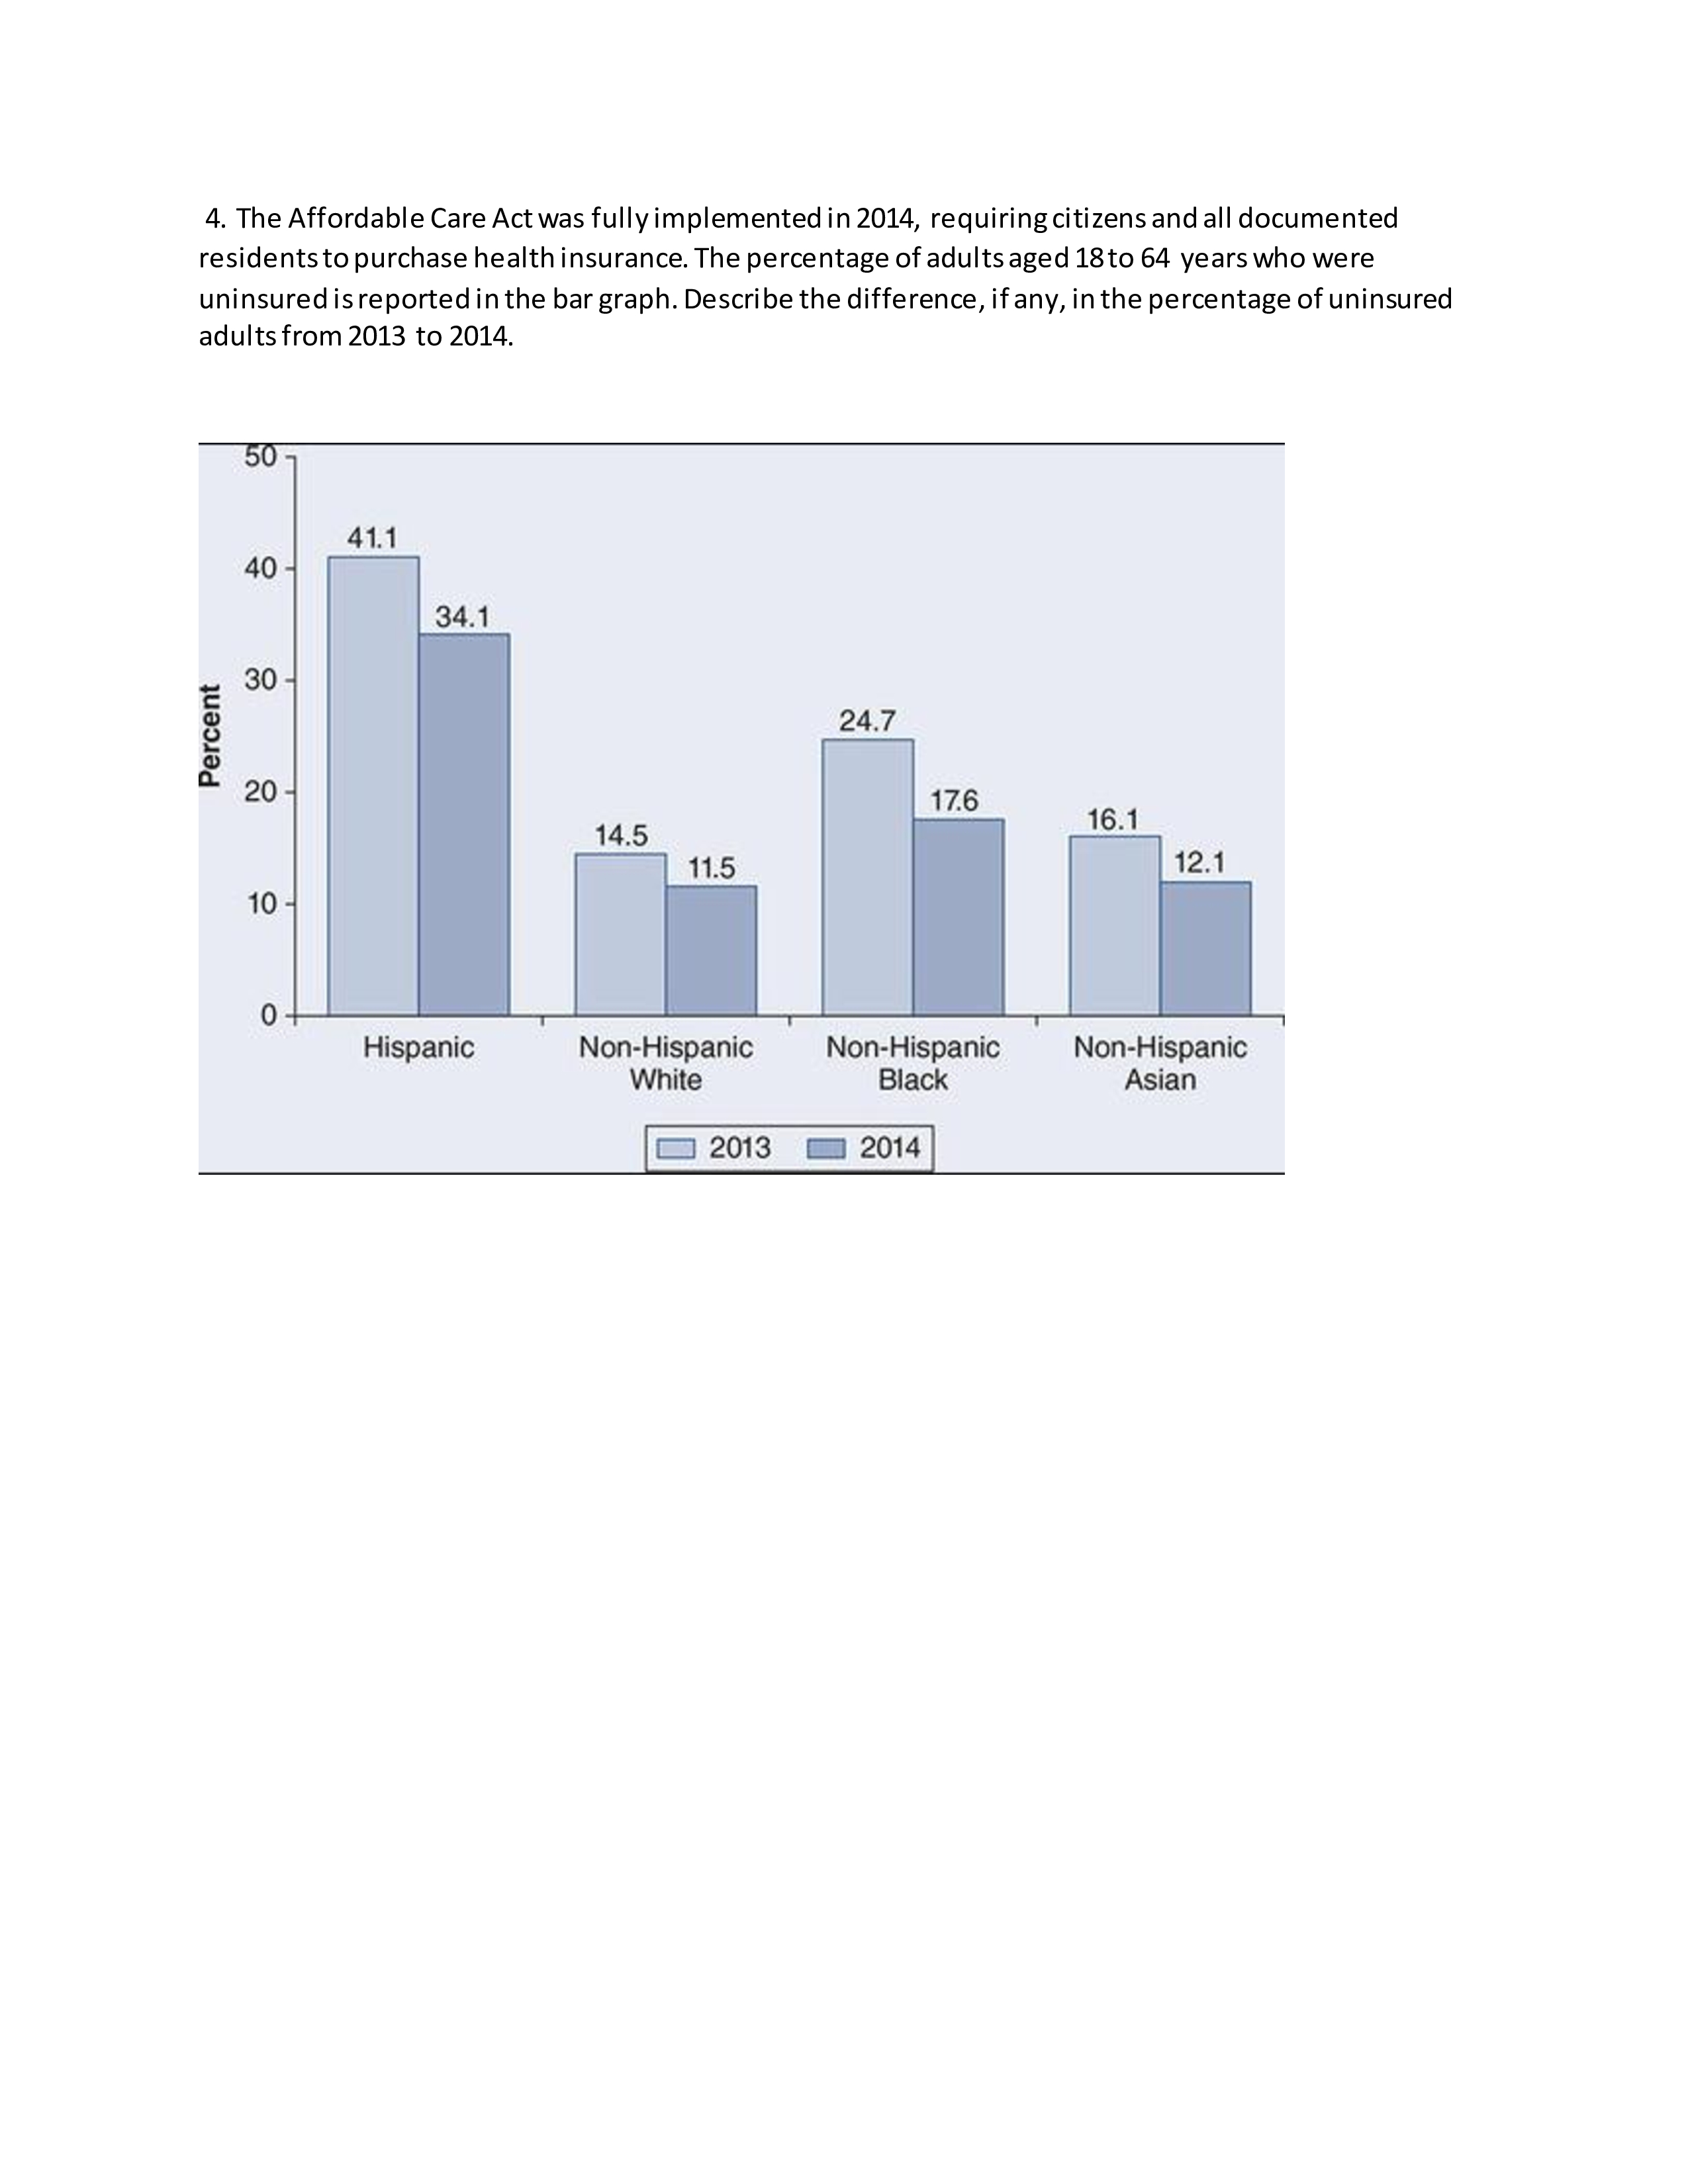
Chapter Two, Part 2 Exercises 1. Using the data below, construct three graphs: one showing percentage distributions for race/ethnicity, one showing percentage distributions for education, and one showing percentage distributions for health issues: Race/Ethnicity Education Health Issues W H 1 W C 0 W C 1 B C 1 L H 2 W H 0 A C 0 W 0 W M 1 B H 1 B H 2 L G 0 A H 0 W G 0 W H 1 W C 0 W G 2 W H 1 W C 1 Race/Ethnicity Education Health Issues B C 0 L C 2 W C 1 W G 0 A C 1 W C 0 W H 0 L C 0 B G 0 B H 1 W H 0 2. How many hours per week do you spend on e-mail? Data are presented here for a GSS sample of 99 men and women, who each reported the number of hours they spent per week on e-mail. Compute the cumulative frequency and cumulative percentage distribution for the data. b. What proportion of the sample spent 2 hours or less per week on e-mail? C. What proportion of the sample spent 7 or more hours per week on e-mail? d. Construct a graph that best displays these data. Explain why the graph you selected is appropriate for these data. Cumulative Cumulative E-mail Hours per Week Frequency Frequency Percentage 0 19 1 20 2 13 Cumulative Cumulative E-mail Hours per Week Frequency Frequency Percentage 3 50 4 2 5 6 6 5 7 2 00 8 3 9 1 10 or more 23 3. One of your classmates hypothesizes that people of color are far less likely to own their own home than white people. Use the following data, which draws from GSS18SSDS-B, to test your classmate's hypothesis. Race Home Ownership Total White Black 475 64 539 Own or is buying 67.7% 41.3% 63% 227 91 318 Pays rent 32.3% 58.7% 58.7% 37% 702 155 857 Total 100% 100% 100% a. Based on your classmate's argument, what is the dependent variable? The independent variable? b. What percentage of those surveyed own their own home? C. Using the percentages in the table, describe the relationship between race and home ownership. 4. The Affordable Care Act was fully implemented in 2014, requiring citizens and all documented residents to purchase health insurance. The percentage of adults aged 18 to 64 years who were uninsured is reported in the bar graph. Describe the difference, if any, in the percentage of uninsured adults from 2013 to 2014. Percent 50 40 41.1 34.1 30 30 20 20 10 14.5 11.5 24.7 17.6 16.1 12.1 0 Hispanic Non-Hispanic White Non-Hispanic Black Non-Hispanic Asian 2013 2014
Step by Step Solution
There are 3 Steps involved in it
Lets go through the problems step by step 1 Construct Graphs for Percentage Distributions StepbyStep ... View full answer

Get step-by-step solutions from verified subject matter experts