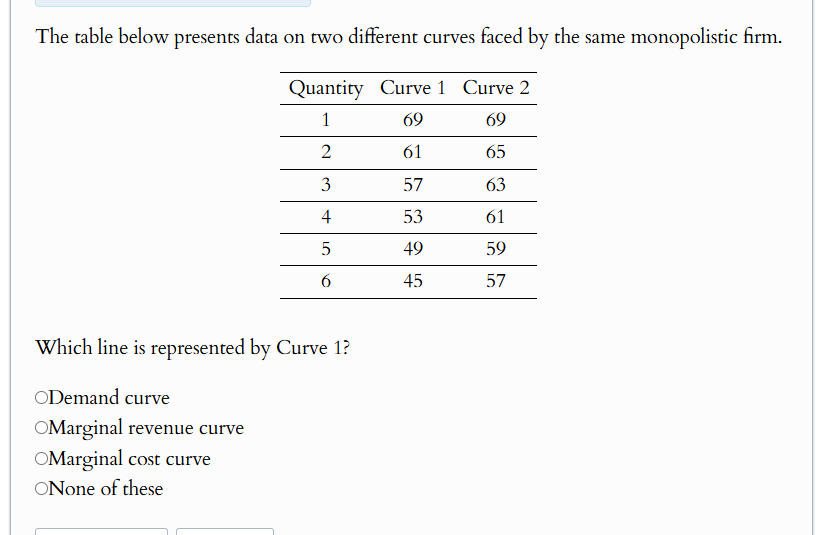
Question: answer The table below presents data on two different curves faced by the same monopolistic firm. Quantity Curve 1 Curve 2 69 69 2 61

answer

answer The table below presents data on two
The table below presents data on two different curves faced by the same monopolistic firm. Quantity Curve 1 Curve 2 69 69 2 61 65 3 57 63 4 53 61 5 49 59 6 45 57 Which line is represented by Curve 1? ODemand curve OMarginal revenue curve OMarginal cost curve ONone of these

Step by Step Solution

There are 3 Steps involved in it

1 Expert Approved Answer
Step: 1 Unlock blur-text-image
Question Has Been Solved by an Expert!

Get step-by-step solutions from verified subject matter experts

Step: 2 Unlock
Step: 3 Unlock

Students Have Also Explored These Related Business Writing Questions!