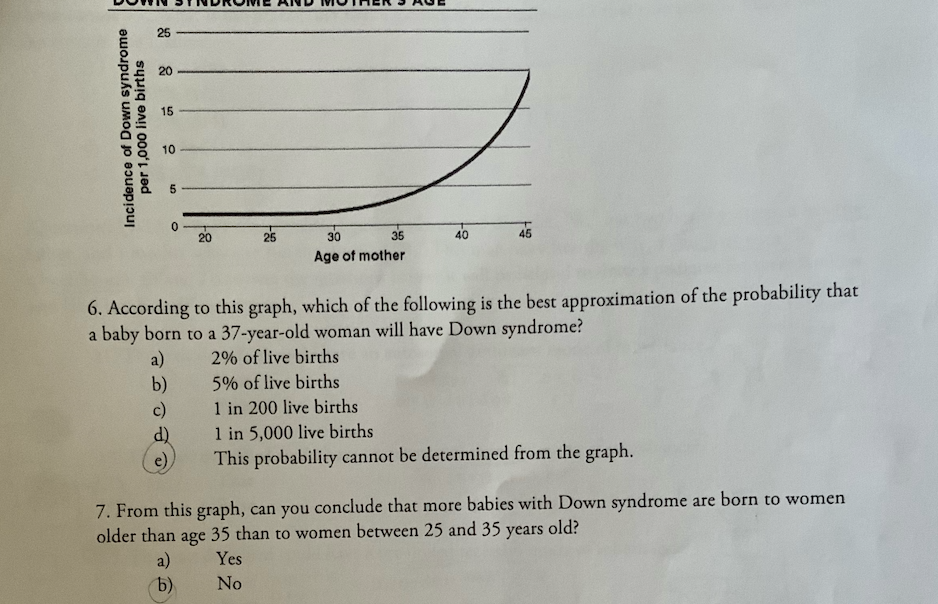
Question: answer the two questions below the graph 25 20 15 per 1,000 live births Incidence of Down syndrome 10 20 25 30 35 40 46

answer the two questions below the graph

answer the two questions below the graph 25 20 15
25 20 15 per 1,000 live births Incidence of Down syndrome 10 20 25 30 35 40 46 Age of mother 6. According to this graph, which of the following is the best approximation of the probability that a baby born to a 37-year-old woman will have Down syndrome? 2% of live births b) 5% of live births C) 1 in 200 live births d) 1 in 5,000 live births e) This probability cannot be determined from the graph. 7. From this graph, can you conclude that more babies with Down syndrome are born to women older than age 35 than to women between 25 and 35 years old? a) Yes b) No

Step by Step Solution

There are 3 Steps involved in it

1 Expert Approved Answer
Step: 1 Unlock blur-text-image
Question Has Been Solved by an Expert!

Get step-by-step solutions from verified subject matter experts

Step: 2 Unlock
Step: 3 Unlock

Students Have Also Explored These Related Mathematics Questions!