

Question: answer them according to the data given in the first picture Below is the information you need to calculate the 4/5 ths rule for this
answer them according to the data given in the first picture
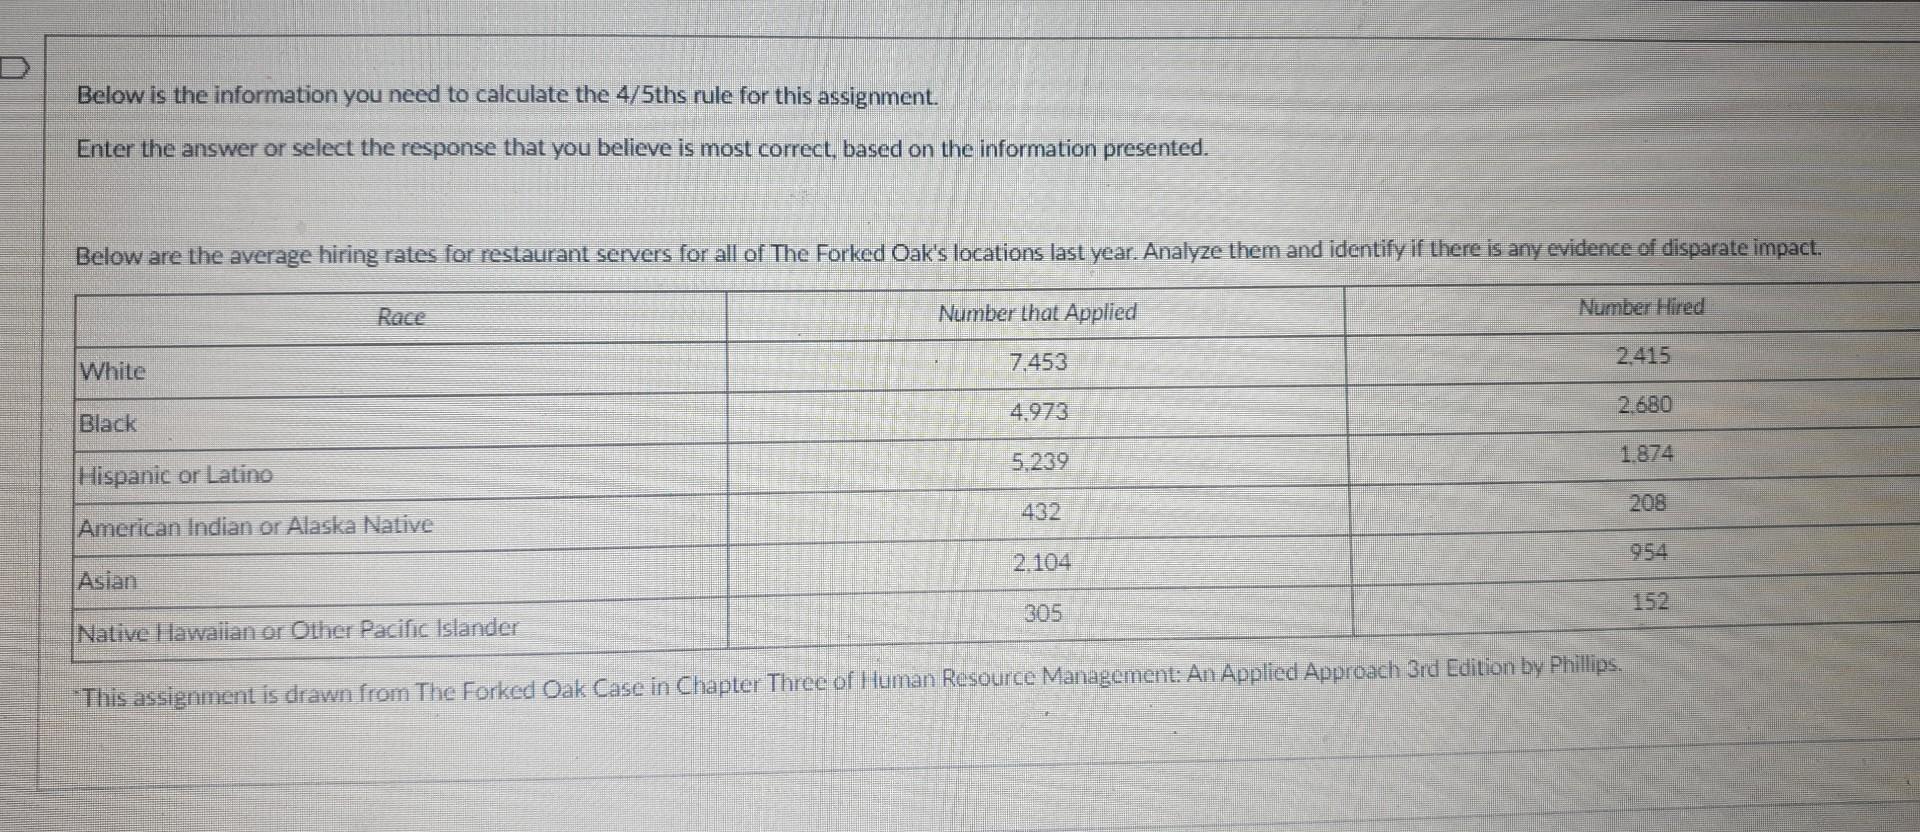
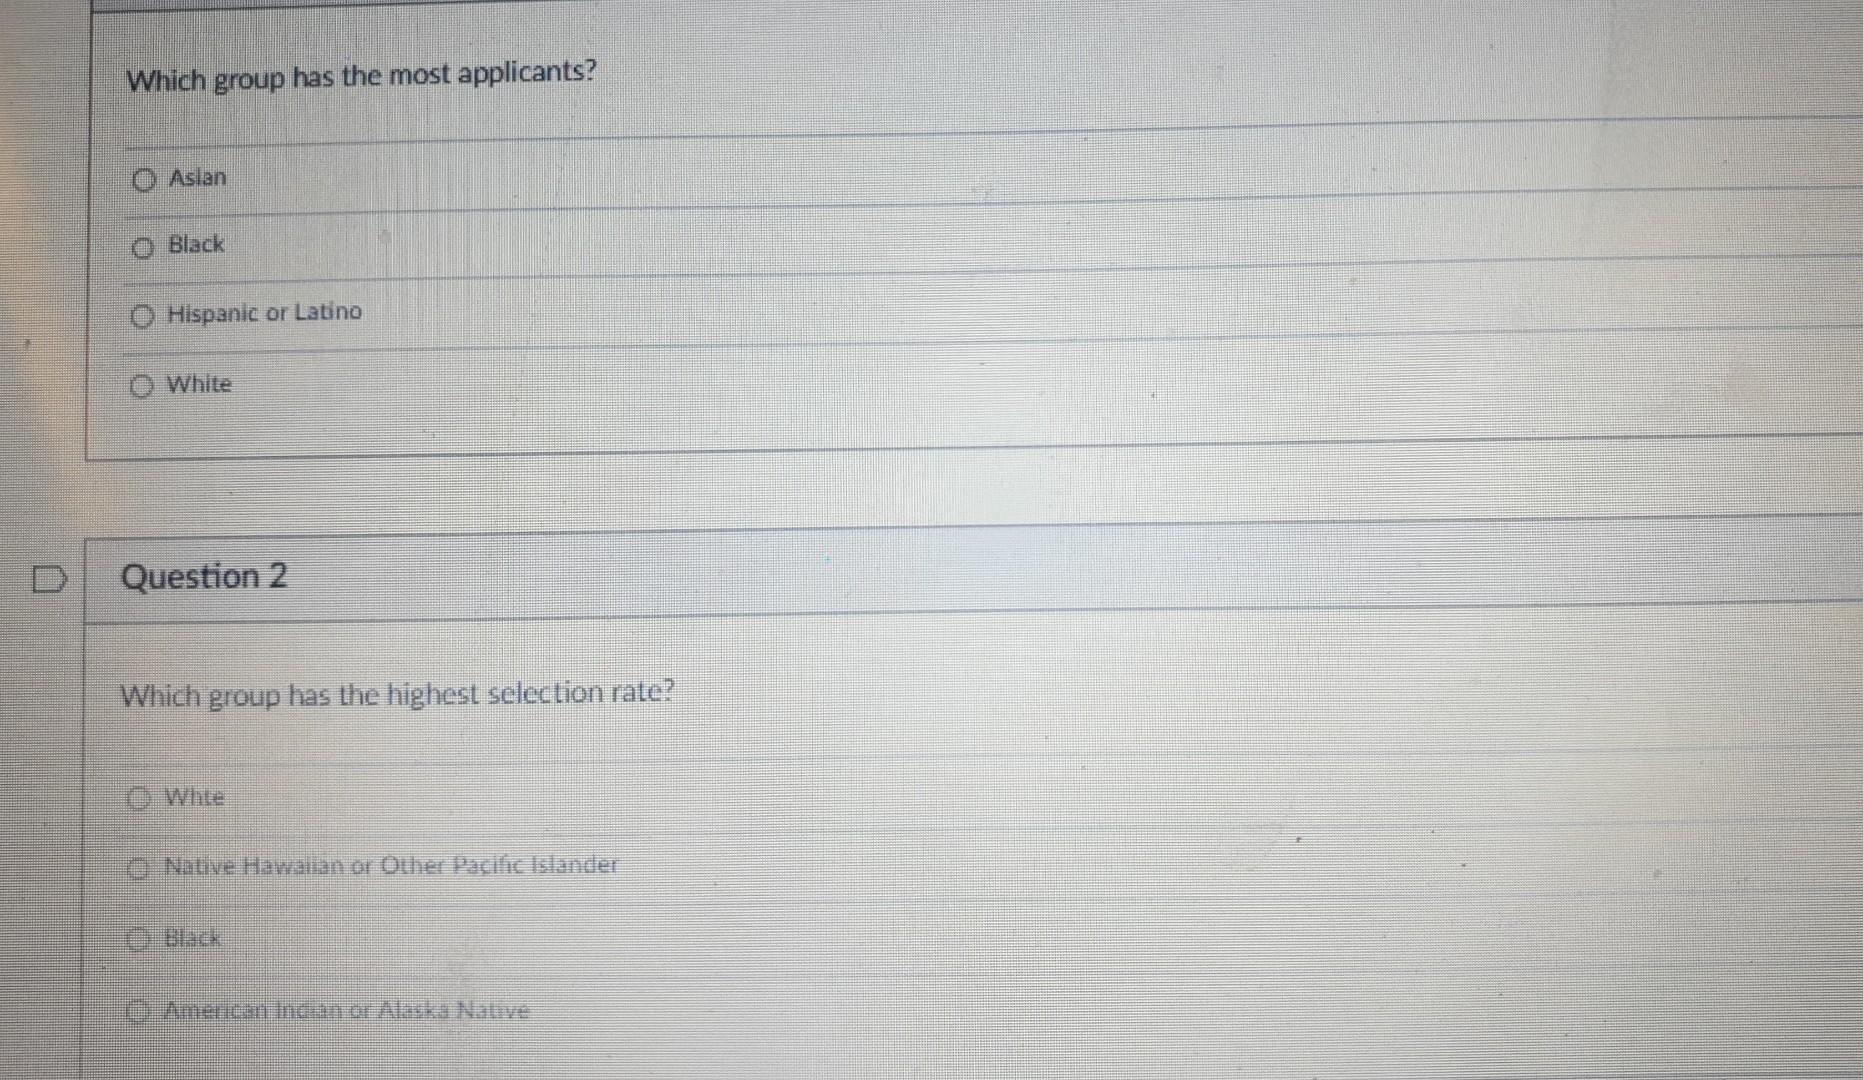
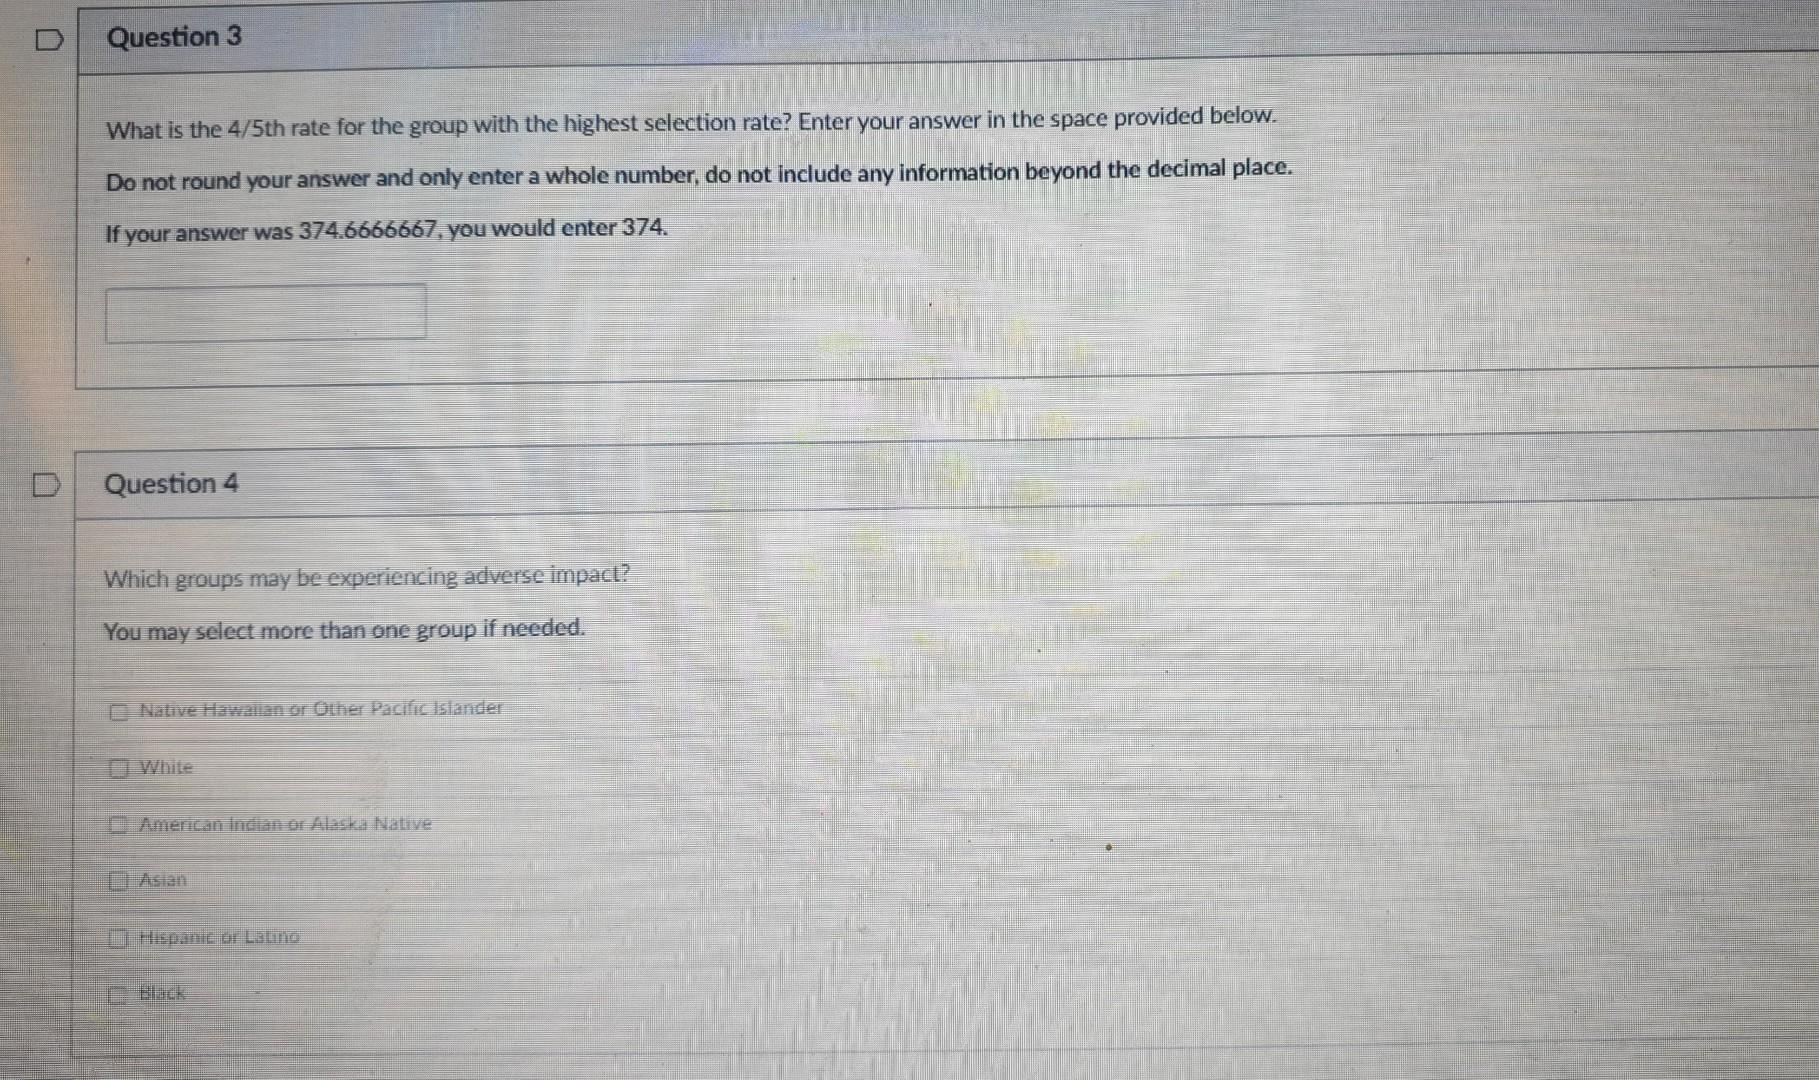
Below is the information you need to calculate the 4/5 ths rule for this assignment. Enter the answer or select the response that you believe is most correct, based on the information presented. Below are the average hiring rates for restaurant servers for all of The Forked Oak's locations last year. Analyze them and identify if there is any evidence of disparate impact. Which group has the most applicants? Asian Black Hispanic or Latino White Question 2 Which group has the highest selection rate? Whte Native Havalan or Other Pacific Isiander What is the 4/5 th rate for the group with the highest selection rate? Enter your answer in the space provided below. Do not round your answer and only enter a whole number, do not include any information beyond the decimal place. If your answer was 374.6666667 , you would enter 374. Question 4 Which groups may be experiencing adverse impact? You may select more than one group if needed. Inative Hatrailan of Outher Pacific Islarider wititere Amiericanililiain of Alaska Wative
Step by Step Solution
There are 3 Steps involved in it

Get step-by-step solutions from verified subject matter experts