

Question: Answer these 8 questions using the information below as soon as possible for THUMBS UP. **DON'T COPY PASTE PREVIOUS SOLUTIONS ON CHEGG** 1) Look at
Answer these 8 questions using the information below as soon as possible for THUMBS UP.
**DON'T COPY PASTE PREVIOUS SOLUTIONS ON CHEGG**
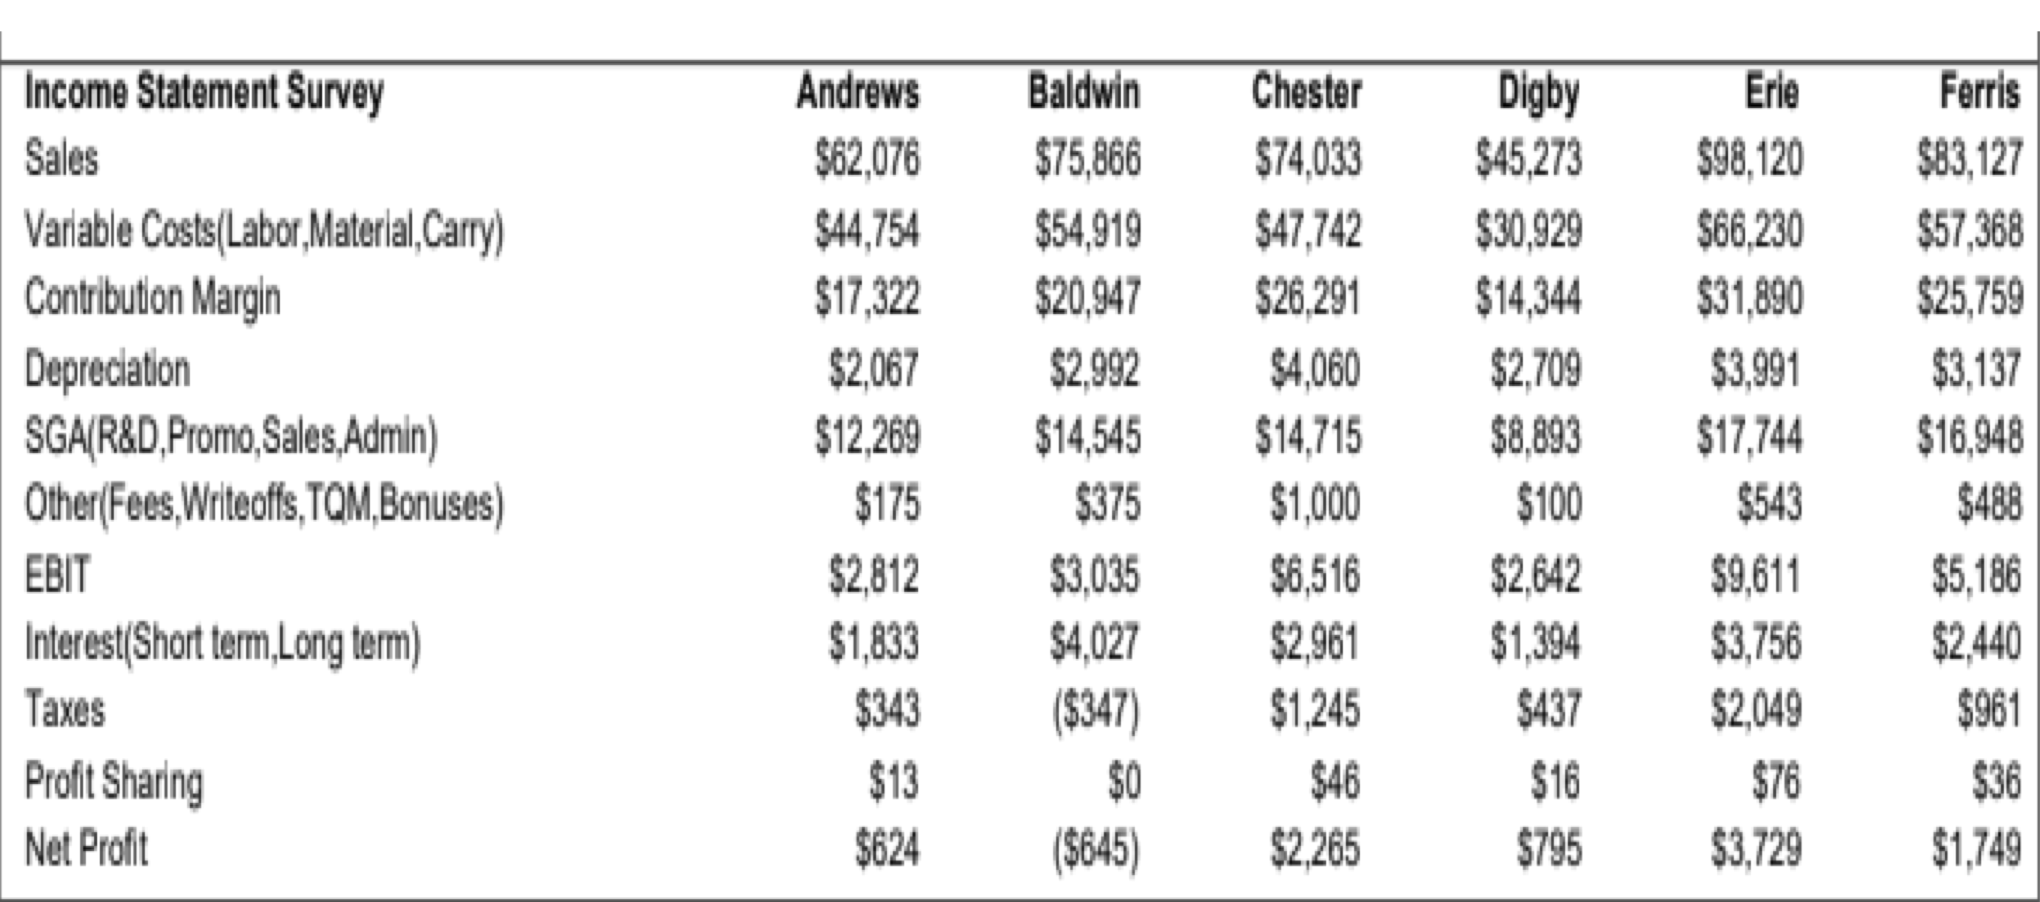
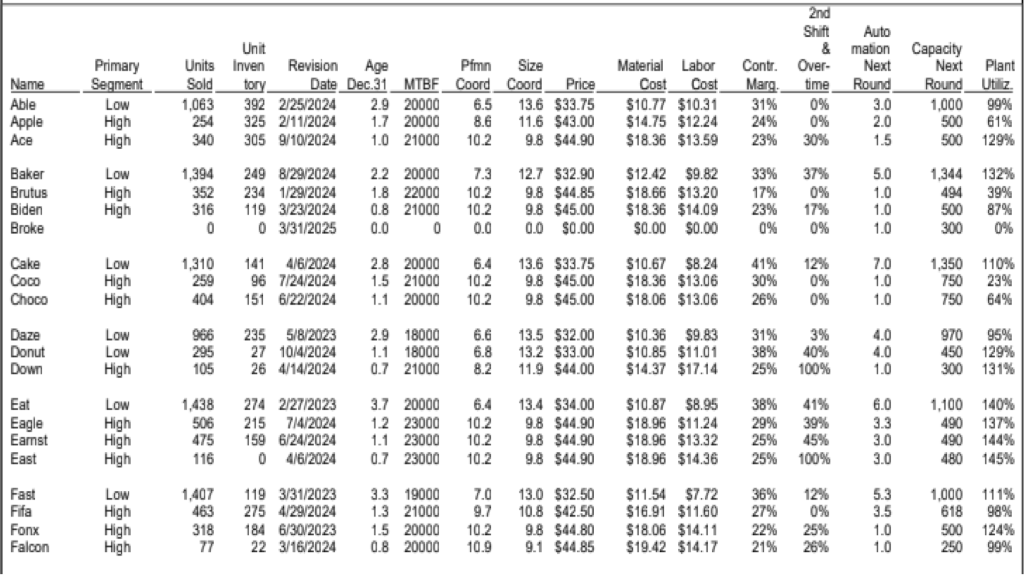
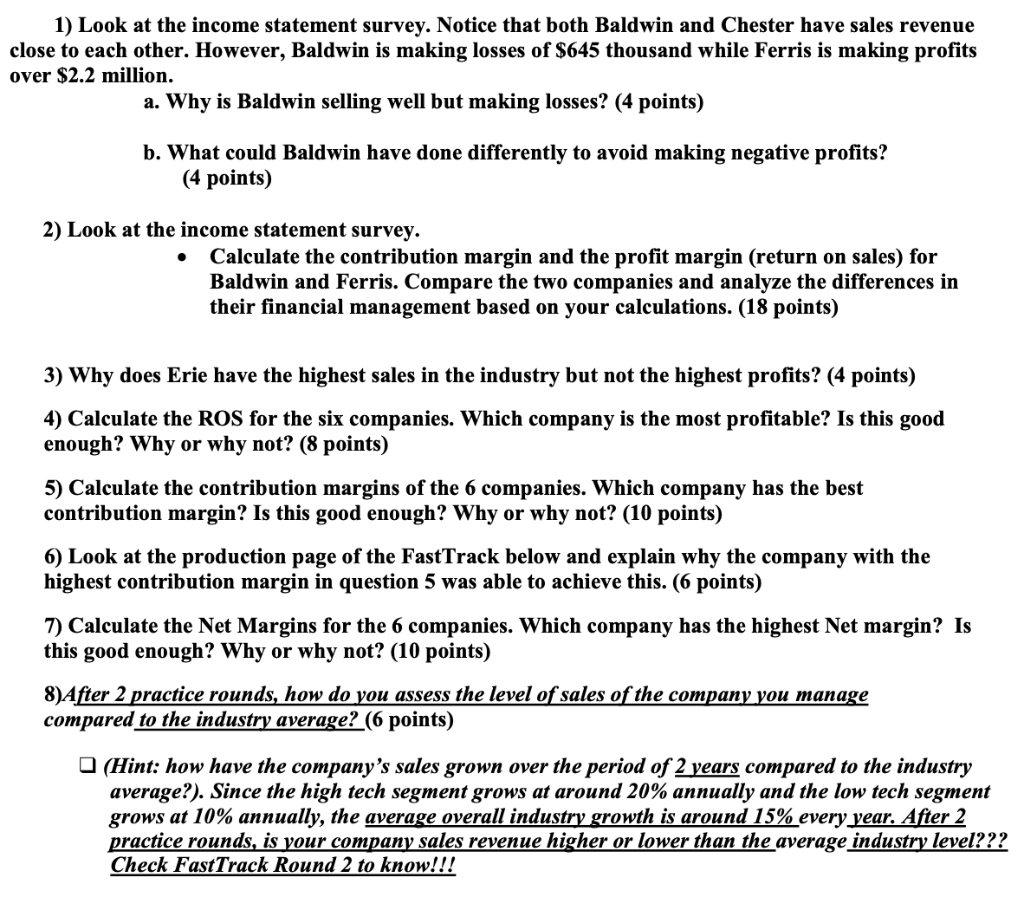
1) Look at the income statement survey. Notice that both Baldwin and Chester have sales revenue close to each other. However, Baldwin is making losses of $645 thousand while Ferris is making profits over $2.2 million. a. Why is Baldwin selling well but making losses? (4 points) b. What could Baldwin have done differently to avoid making negative profits? (4 points) 2) Look at the income statement survey. Calculate the contribution margin and the profit margin (return on sales) for Baldwin and Ferris. Compare the two companies and analyze the differences in their financial management based on your calculations. (18 points) 3) Why does Erie have the highest sales in the industry but not the highest profits? (4 points) 4) Calculate the ROS for the six companies. Which company is the most profitable? Is this good enough? Why or why not? (8 points) 5) Calculate the contribution margins of the 6 companies. Which company has the best contribution margin? Is this good enough? Why or why not? (10 points) 6) Look at the production page of the FastTrack below and explain why the company with the highest contribution margin in question 5 was able to achieve this. (6 points) 7) Calculate the Net Margins for the 6 companies. Which company has the highest Net margin? Is this good enough? Why or why not? (10 points) 8)After 2 practice rounds, how do you assess the level of sales of the company you manage compared to the industry average? (6 points) (Hint: how have the company's sales grown over the period of 2 years compared to the industry average?). Since the high tech segment grows at around 20% annually and the low tech segment grows at 10% annually, the average overall industry growth is around 15% every year. After 2 practice rounds, is your company sales revenue higher or lower than the average industry level??? Check FastTrack Round 2 to know!!! Income Statement Survey Sales Variable Costs(Labor,Material,Carry) Contribution Margin Depreciation SGA(R&D,Promo, Sales, Admin) Other (Fees, Writeoffs, TQM,Bonuses) EBIT Interest(Short term,Long term) Taxes Profit Sharing Net Profit Andrews $62,076 $44,754 $17,322 $2,067 $12,269 $175 $2,812 $1,833 $343 $13 $624 Baldwin Chester Digby Erie $75,866 $74,033 $45,273 $98,120 $54,919 $47,742 $30,929 $66,230 $20,947 $26,291 $14,344 $31,890 $2,992 $4,060 $2,709 $3,991 $14,545 $14,715 $8,893 $17,744 $375 $1,000 $100 $543 $3,035 $6,516 $2,642 $9,611 $4,027 $2,961 $1,394 $3,756 ($347) $1,245 $437 $2,049 $0 $46 $16 $76 ($645) $2,265 $795 $3,729 Ferris $83,127 $57,368 $25,759 $3,137 $16,948 $488 $5,186 $2,440 $961 $36 $1,749 Name Able Apple Ace Baker Brutus Biden Broke Cake Coco Choco Daze Donut Down Eat Eagle Earnst East Fast Fifa Fonx Falcon Unit Units Inven Primary Segment Sold tory Low High High Low High High LOW High High Low Low High Low High High High Low High High High Pimn Size Coord Coord Price 13.6 $33.75 11.6 $43.00 9.8 $44.90 12.7 $32.90 9.8 $44.85 9.8 $45.00 0.0 $0.00 13.6 $33.75 9.8 $45.00 9.8 $45.00 13.5 $32.00 13.2 $33.00 11.9 $44.00 13.4 $34.00 9.8 $44.90 9.8 $44.90 9.8 $44.90 13.0 $32.50 10.8 $42.50 9.8 $44.80 9.1 $44.85 Revision Age Date Dec.31 MTBF 1,063 392 2/25/2024 2.9 20000 6.5 254 325 2/11/2024 1.7 20000 8.6 305 9/10/2024 1.0 21000 10.2 340 1,394 249 8/29/2024 352 234 1/29/2024 2.2 20000 1.8 22000 0.8 21000 0.0 7.3 10.2 10.2 0.0 316 119 3/23/2024 03/31/2025 0 0 1,310 141 4/6/2024 2.8 20000 1.5 21000 259 96 7/24/2024 6.4 10.2 10.2 404 151 6/22/2024 1.1 20000 966 235 5/8/2023 2.9 18000 1.1 18000 295 27 10/4/2024 105 26 4/14/2024 6.6 6.8 8.2 0.7 21000 1,438 274 2/27/2023 506 3.7 20000 6.4 1.2 23000 10.2 1.1 23000 10.2 0.7 23000 10.2 215 7/4/2024 159 6/24/2024 0 4/6/2024 475 116 1,407 463 119 3/31/2023 275 4/29/2024 184 6/30/2023 22 3/16/2024 3.3 19000 1.3 21000 1.5 20000 7.0 9.7 10.2 10.9 318 77 0.8 20000 2nd Shift Material Labor Contr. Over- Cost Cost Marg time 0% $10.77 $10.31 31% $14.75 $12.24 24% $18.36 $13.59 23% 30% 0% $12.42 $9.82 33% 37% $18.66 $13.20 17% 0% $18.36 $14.09 23% 17% $0.00 $0.00 0% 0% 12% $10.67 $8.24 41% $18.36 $13.06 30% 0% $18.06 $13.06 26% 0% 31% 3% $10.36 $9.83 $10.85 $11.01 $14.37 $17.14 38% 40% 25% 100% 38% 41% 29% 39% $10.87 $8.95 $18.96 $11.24 $18.96 $13.32 $18.96 $14.36 25% 45% 25% 100% 12% $11.54 $7.72 $16.91 $11.60 $18.06 $14.11 $19.42 $14.17 36% 27% 0% 22% 25% 21% 26% Auto & mation Capacity Next Round 3.0 2.0 1.5 5.0 1.0 1.0 1.0 7.0 1.0 1.0 4.0 4.0 1.0 6.0 3.3 3.0 3.0 5.3 3.5 1.0 1.0 p]*** **** *** *** *** *** Plant Utiliz 99% 61% 129% 132% 39% 87% 0% 110% 23% 64% 95% 129% 131% 1,100 140% 137% 144% 145% 111% 98% 500 124% 99% 1) Look at the income statement survey. Notice that both Baldwin and Chester have sales revenue close to each other. However, Baldwin is making losses of $645 thousand while Ferris is making profits over $2.2 million. a. Why is Baldwin selling well but making losses? (4 points) b. What could Baldwin have done differently to avoid making negative profits? (4 points) 2) Look at the income statement survey. Calculate the contribution margin and the profit margin (return on sales) for Baldwin and Ferris. Compare the two companies and analyze the differences in their financial management based on your calculations. (18 points) 3) Why does Erie have the highest sales in the industry but not the highest profits? (4 points) 4) Calculate the ROS for the six companies. Which company is the most profitable? Is this good enough? Why or why not? (8 points) 5) Calculate the contribution margins of the 6 companies. Which company has the best contribution margin? Is this good enough? Why or why not? (10 points) 6) Look at the production page of the FastTrack below and explain why the company with the highest contribution margin in question 5 was able to achieve this. (6 points) 7) Calculate the Net Margins for the 6 companies. Which company has the highest Net margin? Is this good enough? Why or why not? (10 points) 8)After 2 practice rounds, how do you assess the level of sales of the company you manage compared to the industry average? (6 points) (Hint: how have the company's sales grown over the period of 2 years compared to the industry average?). Since the high tech segment grows at around 20% annually and the low tech segment grows at 10% annually, the average overall industry growth is around 15% every year. After 2 practice rounds, is your company sales revenue higher or lower than the average industry level??? Check FastTrack Round 2 to know!!! Income Statement Survey Sales Variable Costs(Labor,Material,Carry) Contribution Margin Depreciation SGA(R&D,Promo, Sales, Admin) Other (Fees, Writeoffs, TQM,Bonuses) EBIT Interest(Short term,Long term) Taxes Profit Sharing Net Profit Andrews $62,076 $44,754 $17,322 $2,067 $12,269 $175 $2,812 $1,833 $343 $13 $624 Baldwin Chester Digby Erie $75,866 $74,033 $45,273 $98,120 $54,919 $47,742 $30,929 $66,230 $20,947 $26,291 $14,344 $31,890 $2,992 $4,060 $2,709 $3,991 $14,545 $14,715 $8,893 $17,744 $375 $1,000 $100 $543 $3,035 $6,516 $2,642 $9,611 $4,027 $2,961 $1,394 $3,756 ($347) $1,245 $437 $2,049 $0 $46 $16 $76 ($645) $2,265 $795 $3,729 Ferris $83,127 $57,368 $25,759 $3,137 $16,948 $488 $5,186 $2,440 $961 $36 $1,749 Name Able Apple Ace Baker Brutus Biden Broke Cake Coco Choco Daze Donut Down Eat Eagle Earnst East Fast Fifa Fonx Falcon Unit Units Inven Primary Segment Sold tory Low High High Low High High LOW High High Low Low High Low High High High Low High High High Pimn Size Coord Coord Price 13.6 $33.75 11.6 $43.00 9.8 $44.90 12.7 $32.90 9.8 $44.85 9.8 $45.00 0.0 $0.00 13.6 $33.75 9.8 $45.00 9.8 $45.00 13.5 $32.00 13.2 $33.00 11.9 $44.00 13.4 $34.00 9.8 $44.90 9.8 $44.90 9.8 $44.90 13.0 $32.50 10.8 $42.50 9.8 $44.80 9.1 $44.85 Revision Age Date Dec.31 MTBF 1,063 392 2/25/2024 2.9 20000 6.5 254 325 2/11/2024 1.7 20000 8.6 305 9/10/2024 1.0 21000 10.2 340 1,394 249 8/29/2024 352 234 1/29/2024 2.2 20000 1.8 22000 0.8 21000 0.0 7.3 10.2 10.2 0.0 316 119 3/23/2024 03/31/2025 0 0 1,310 141 4/6/2024 2.8 20000 1.5 21000 259 96 7/24/2024 6.4 10.2 10.2 404 151 6/22/2024 1.1 20000 966 235 5/8/2023 2.9 18000 1.1 18000 295 27 10/4/2024 105 26 4/14/2024 6.6 6.8 8.2 0.7 21000 1,438 274 2/27/2023 506 3.7 20000 6.4 1.2 23000 10.2 1.1 23000 10.2 0.7 23000 10.2 215 7/4/2024 159 6/24/2024 0 4/6/2024 475 116 1,407 463 119 3/31/2023 275 4/29/2024 184 6/30/2023 22 3/16/2024 3.3 19000 1.3 21000 1.5 20000 7.0 9.7 10.2 10.9 318 77 0.8 20000 2nd Shift Material Labor Contr. Over- Cost Cost Marg time 0% $10.77 $10.31 31% $14.75 $12.24 24% $18.36 $13.59 23% 30% 0% $12.42 $9.82 33% 37% $18.66 $13.20 17% 0% $18.36 $14.09 23% 17% $0.00 $0.00 0% 0% 12% $10.67 $8.24 41% $18.36 $13.06 30% 0% $18.06 $13.06 26% 0% 31% 3% $10.36 $9.83 $10.85 $11.01 $14.37 $17.14 38% 40% 25% 100% 38% 41% 29% 39% $10.87 $8.95 $18.96 $11.24 $18.96 $13.32 $18.96 $14.36 25% 45% 25% 100% 12% $11.54 $7.72 $16.91 $11.60 $18.06 $14.11 $19.42 $14.17 36% 27% 0% 22% 25% 21% 26% Auto & mation Capacity Next Round 3.0 2.0 1.5 5.0 1.0 1.0 1.0 7.0 1.0 1.0 4.0 4.0 1.0 6.0 3.3 3.0 3.0 5.3 3.5 1.0 1.0 p]*** **** *** *** *** *** Plant Utiliz 99% 61% 129% 132% 39% 87% 0% 110% 23% 64% 95% 129% 131% 1,100 140% 137% 144% 145% 111% 98% 500 124% 99%
Step by Step Solution
There are 3 Steps involved in it

Get step-by-step solutions from verified subject matter experts