

Question: Answer these numericals fA random sample of soil specimens was obtained, and the amount of organic mailer (5%.) if! the soil was determined for each
Answer these numericals
![Science] 1998: 9&102}. 1.10 0.14 3.98 0.76 5.09 4.47 3.17 1.17 0.97](https://dsd5zvtm8ll6.cloudfront.net/si.experts.images/questions/2024/10/670906547bcc1_692670906546b6dc.jpg)
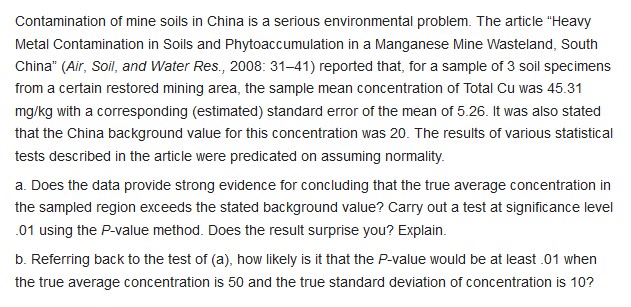
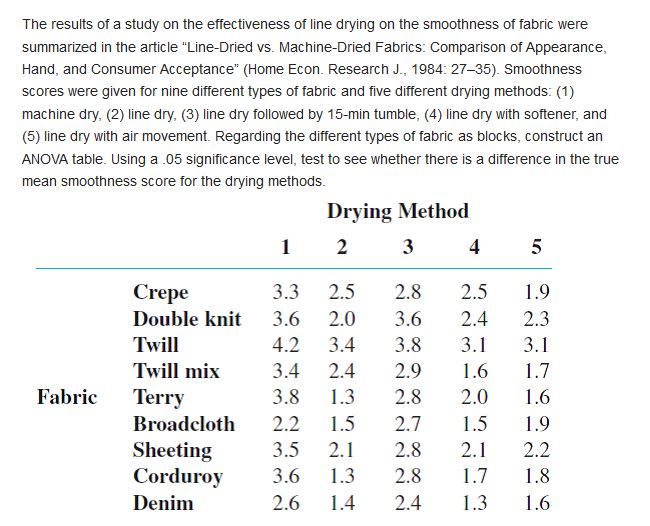
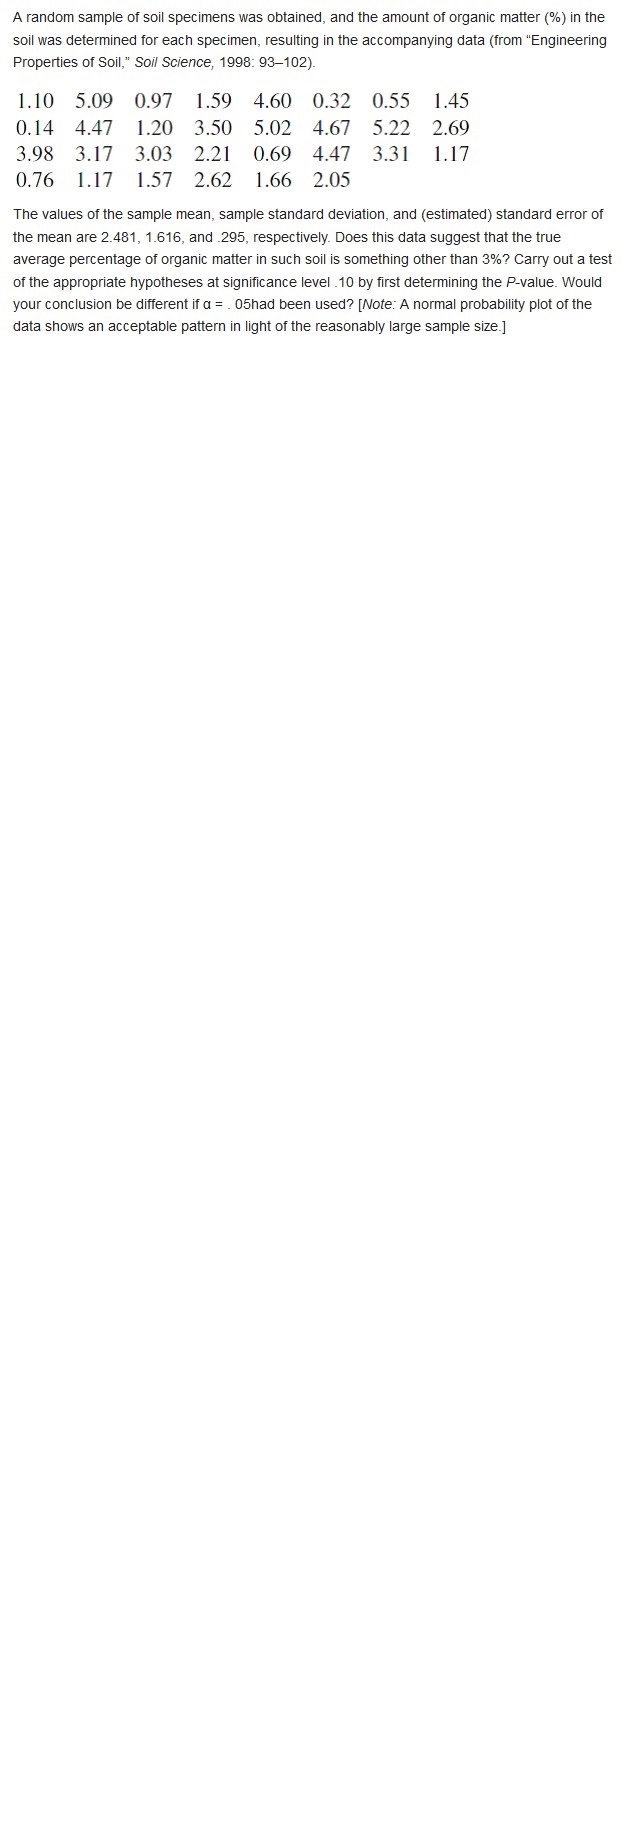
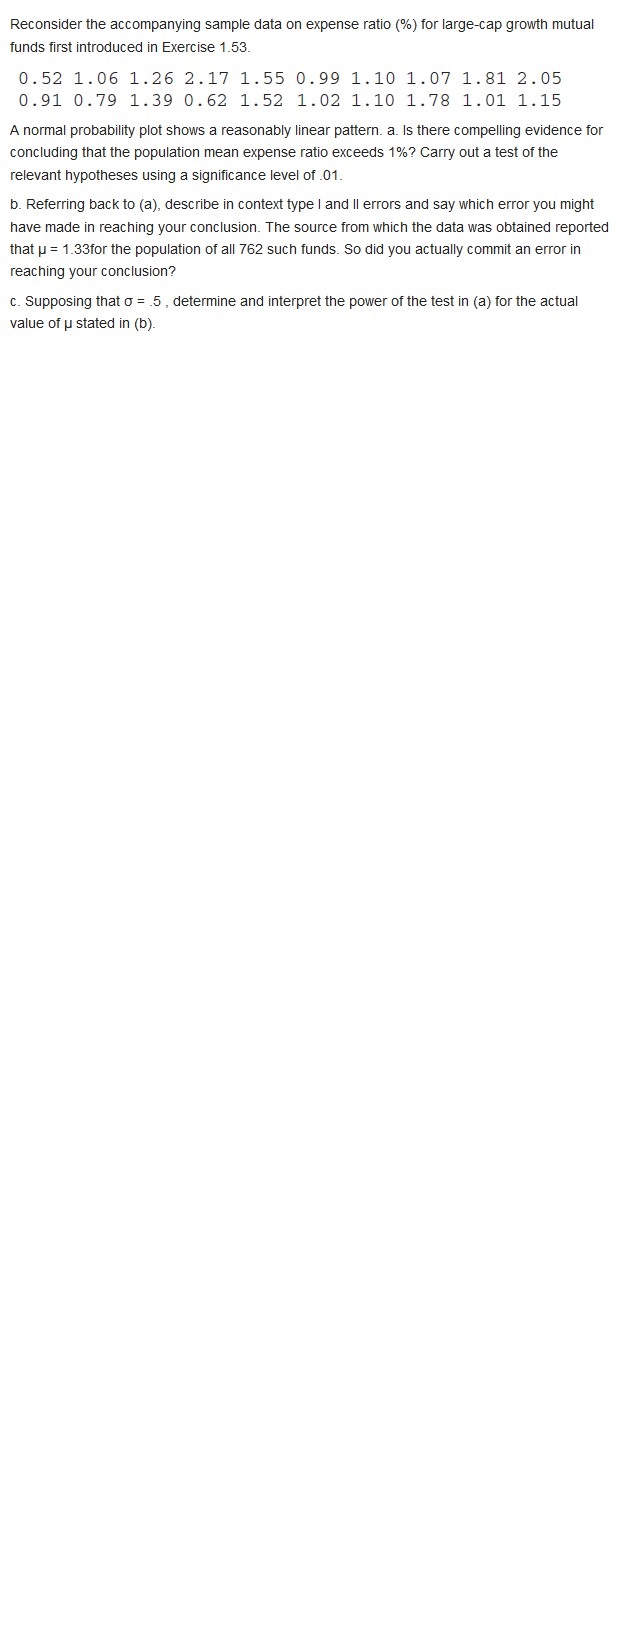
\fA random sample of soil specimens was obtained, and the amount of organic mailer (5%.) if! the soil was determined for each specimen, resulting in the accompanying data (from "Engineering Properties ofSoiI," Soil Science] 1998: 9&102}. 1.10 0.14 3.98 0.76 5.09 4.47 3.17 1.17 0.97 l .20 3.03 l .57 1.59 3.50 2.21 2.62 4.60 5.02 0.69 1.66 0.32 4.67 4.47 2.05 0.55 1.45 5.22 2.69 3.31 1.17 The values of the sample mean, sample standard deviation, and (estimated) standard error of the mean are 2.481, 1.616, and .295, respectively. Does this data suggest that the true average percentage of organic matter in such soil is something other than 3%? Carry out a test of the appropriate hypotheses at significance level .10 by rst determining the Pvalue. Would yourconclusion be different Eta = . Ohad been used? [More A normal probability plot of the data shows an acceptable pattern in light of the reasonably large sample size] Reconsider the accompanying sample data on expense ratio (5i: funds first introduced in Exercise 1.53. 0.52 1.06 1.26 2.17 1.55 0.99 1.10 _ 0.91 0.79 1.39 0.62 1-52 1.02 1.10 1.78 1.01 1.15 )for largecap growth mutual _.0'? 1.81 2.05 A normal probability plot shows a reasonably linear pattern. a. Is there compelling evidence for concluding that the population mean expense ratio exceeds 1%? Carry out a test of the relevant hypotheses using a signicance level of .01. b. Referring back to (a), describe in context type I and II errors and say which error you might have made in reaching your conclusion. The source from which that u = 1 .33for the population of all 762 such funds. 80 did you reaching your conclusion? c. Supposing that o = .5 , determine and interpret the power oft value or u stated in (b). the data was obtained reported actually commit an error in he test in (a) for the actual With domestic sources of building supplies running low several years ago, roughly 60,000 homes were built with imported Chinese drywall. According to the article "Report Links Chinese Drywall to Home Problems" (New York Times, Nov. 24, 2009), federal investigators identified a strong association between chemicals in the drywall and electrical problems, and there is also strong evidence of respiratory difficulties due to the emission of hydrogen sulfide gas. An extensive examination of 51 homes found that 41 had such problems. Suppose these 51 were randomly sampled from the population of all homes having Chinese drywall. a. Does the data provide strong evidence for concluding that more than 50% of all homes with Chinese drywall have electrical/environmental problems? Carry out a test of hypotheses using a = .01. b. Calculate a lower confidence bound using a confidence level of 99% for the percentage of all such homes that have electrical/environmental problems. c. If it is actually the case that 80% of all such homes have problems, how likely is it that the test of (a) would not conclude that more than 50% do?Contamination of mine soils in China is a serious environmental problem. The article "Heavy Metal Contamination in Soils and Phytoaccumulation in a Manganese Mine Wasteland, South China" (Air, Soil, and Water Res., 2008: 31-41) reported that, for a sample of 3 soil specimens from a certain restored mining area, the sample mean concentration of Total Cu was 45.31 mg/kg with a corresponding (estimated) standard error of the mean of 5.26. It was also stated that the China background value for this concentration was 20. The results of various statistical tests described in the article were predicated on assuming normality. a. Does the data provide strong evidence for concluding that the true average concentration in the sampled region exceeds the stated background value? Carry out a test at significance level 01 using the P-value method. Does the result surprise you? Explain. b. Referring back to the test of (a), how likely is it that the P-value would be at least .01 when the true average concentration is 50 and the true standard deviation of concentration is 10
Step by Step Solution
There are 3 Steps involved in it

Get step-by-step solutions from verified subject matter experts