

Question: Answer these numericals Refer to Example 12.12 in which x = test track speed and y = rolling test speed. a. Minitab gave a. Minitab
Answer these numericals
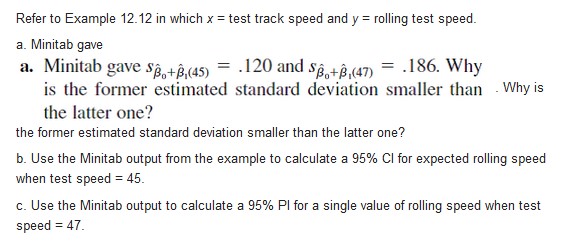


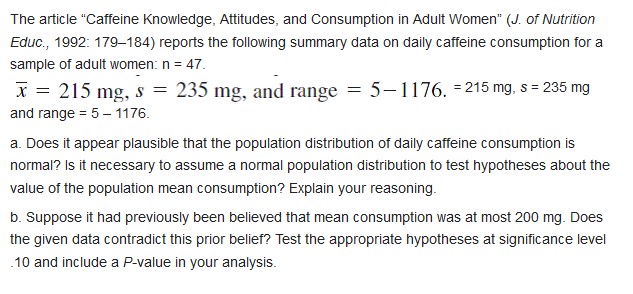
Refer to Example 12.12 in which x = test track speed and y = rolling test speed. a. Minitab gave a. Minitab gave SB + 8,(45) = . 120 and $8 +8,(47) = 186. Why is the former estimated standard deviation smaller than - Why is the latter one? the former estimated standard deviation smaller than the latter one? b. Use the Minitab output from the example to calculate a 95% Cl for expected rolling speed when test speed = 45. c. Use the Minitab output to calculate a 95% PI for a single value of rolling speed when test speed = 47.\fReconsider the accompanying sample data on expense ratio (5i: funds first introduced in Exercise 1.53. 0.52 1.06 1.26 2.17 1.55 0.99 1.10 _ 0.91 0.79 1.39 0.62 1-52 1.02 1.10 1.78 1.01 1.15 )for largecap growth mutual _.0'? 1.81 2.05 A normal probability plot shows a reasonably linear pattern. a. Is there compelling evidence for concluding that the population mean expense ratio exceeds 1%? Carry out a test of the relevant hypotheses using a signicance level of .01. b. Referring back to (a), describe in context type I and II errors and say which error you might have made in reaching your conclusion. The source from which that u = 1 .33for the population of all 762 such funds. 80 did you reaching your conclusion? c. Supposing that o = .5 , determine and interpret the power oft value or u stated in (b). the data was obtained reported actually commit an error in he test in (a) for the actual The article "Caffeine Knowledge, Attitudes, and Consumption in Adult Women" (J. of Nutrition Educ., 1992: 179-184) reports the following summary data on daily caffeine consumption for a sample of adult women: n = 47. x = 215 mg, s = 235 mg, and range = 5-1176. = 215 mg, s = 235 mg and range = 5 - 1176. a. Does it appear plausible that the population distribution of daily caffeine consumption is normal? Is it necessary to assume a normal population distribution to test hypotheses about the value of the population mean consumption? Explain your reasoning. b. Suppose it had previously been believed that mean consumption was at most 200 mg. Does the given data contradict this prior belief? Test the appropriate hypotheses at significance level 10 and include a P-value in your analysis
Step by Step Solution
There are 3 Steps involved in it

Get step-by-step solutions from verified subject matter experts