

Question: Answer these problems: Head movement evaluations are important because individuals, especially those who are disabled, may be able to operate communications aids in this manner.
Answer these problems:
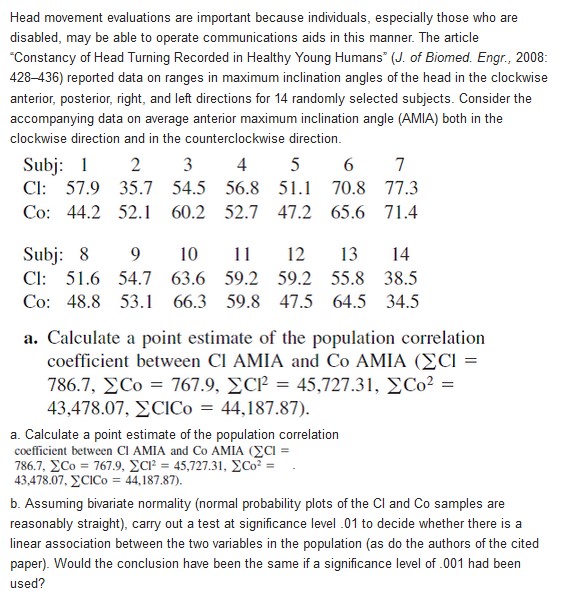
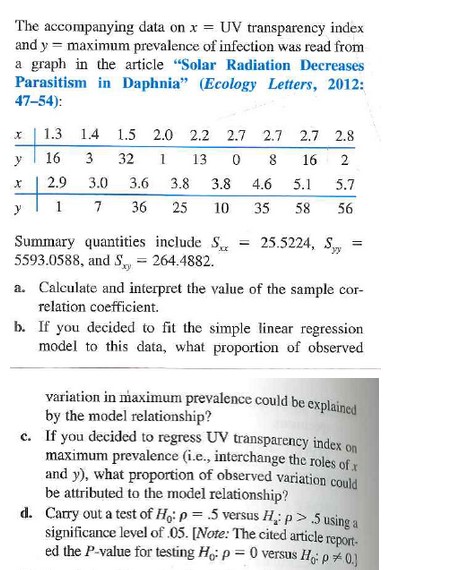
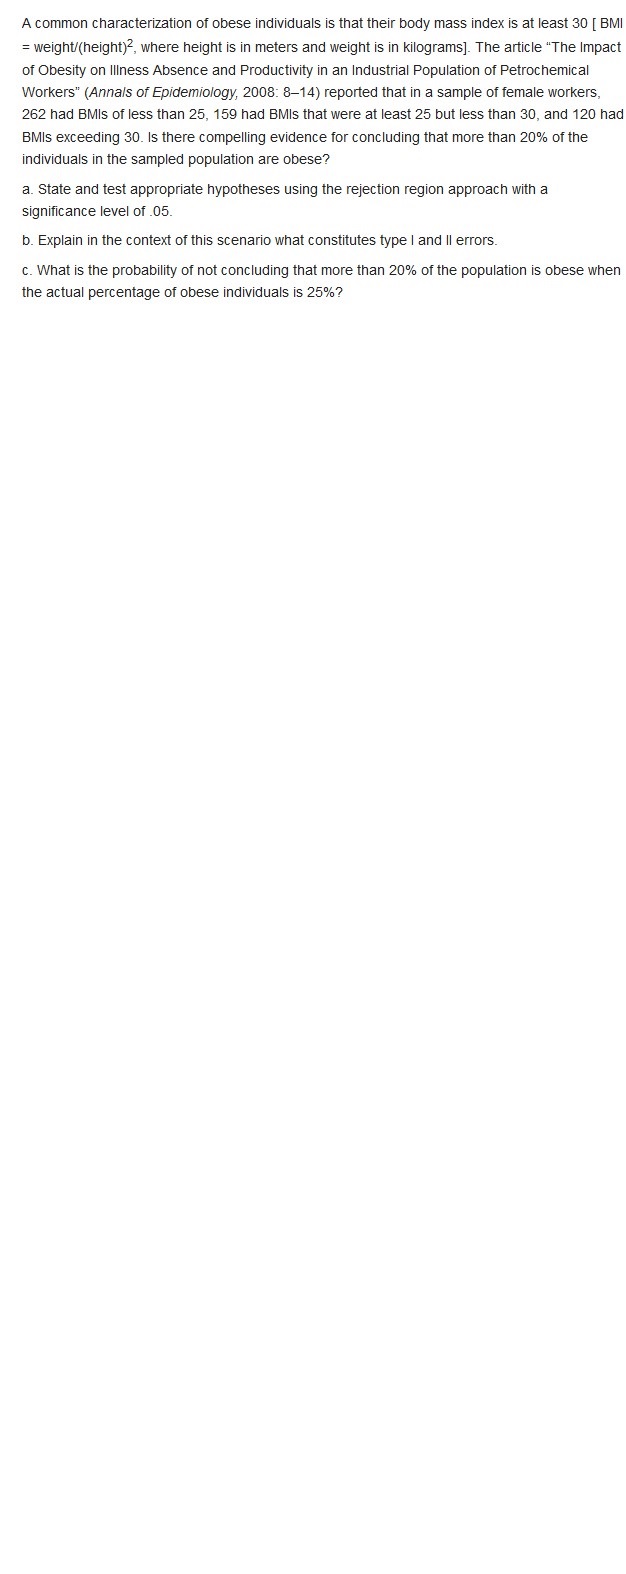
Head movement evaluations are important because individuals, especially those who are disabled, may be able to operate communications aids in this manner. The article Constancy of Head Turning Recorded in Healthy Young Humans" (J. of Biomed. Engr., 2008: 428-436) reported data on ranges in maximum inclination angles of the head in the clockwise anterior, posterior, right, and left directions for 14 randomly selected subjects. Consider the accompanying data on average anterior maximum inclination angle (AMIA) both in the clockwise direction and in the counterclockwise direction. Subj: 1 2 3 4 5 6 7 CI: 57.9 35.7 54.5 56.8 51.1 70.8 77.3 Co: 44.2 52.1 60.2 52.7 47.2 65.6 71.4 Subj: 8 9 10 11 12 13 14 Cl: 51.6 54.7 63.6 59.2 59.2 55.8 38.5 Co: 48.8 53.1 66.3 59.8 47.5 64.5 34.5 a. Calculate a point estimate of the population correlation coefficient between CI AMIA and Co AMIA (ECI = 786.7, ECo = 767.9, ECP = 45,727.31, >Co2 = 43,478.07, ECICo = 44,187.87). a. Calculate a point estimate of the population correlation coefficient between CI AMIA and Co AMIA (ECI = 786.7, Co = 767.9, ECI' = 45,727.31, ECo' = 43,478.07. _CICo = 44,187.87). b. Assuming bivariate normality (normal probability plots of the CI and Co samples are reasonably straight), carry out a test at significance level .01 to decide whether there is a linear association between the two variables in the population (as do the authors of the cited paper). Would the conclusion have been the same if a significance level of .001 had been used?The accompanying data on x = UV transparency index and y = maximum prevalence of infection was read from a graph in the article "Solar Radiation Decreases Parasitism in Daphnia" (Ecology Letters, 2012: 47-54): 1.3 1.4 1.5 2.0 2.2 2.7 2.7 2.7 2.8 16 3 32 1 13 0 8 16 1 2 X 2.9 3.0 3.6 3.8 3.8 4.6 5.1 5.7 1 7 36 25 10 35 58 56 Summary quantities include S. = 25.5224, S.= 5593.0588, and S,= 264.4882. a. Calculate and interpret the value of the sample cor- relation coefficient. b. If you decided to fit the simple linear regression model to this data, what proportion of observed Variation in maximum prevalence could be explained by the model relationship? c. If you decided to regress UV transparency index on maximum prevalence (i.e., interchange the roles of r and y), what proportion of observed variation could be attributed to the model relationship? d. Carry out a test of Ho: p = .5 versus He: p > .5 using a significance level of .05. [Note: The cited article report- ed the P-value for testing Ho: p = 0 versus Hop * 0.]A common characterization of obese individuals is that their body mass index is at least 30 [ BMI = weight/(height)", where height is in meters and weight is in kilograms]. The article "The Impact of Obesity on Illness Absence and Productivity in an Industrial Population of Petrochemical Workers" (Annals of Epidemiology, 2008: 8-14) reported that in a sample of female workers, 262 had BMIs of less than 25, 159 had BMIs that were at least 25 but less than 30, and 120 had BMIs exceeding 30. Is there compelling evidence for concluding that more than 20% of the individuals in the sampled population are obese? a. State and test appropriate hypotheses using the rejection region approach with a significance level of .05. b. Explain in the context of this scenario what constitutes type I and ll errors. c. What is the probability of not concluding that more than 20% of the population is obese when the actual percentage of obese individuals is 25%
Step by Step Solution
There are 3 Steps involved in it

Get step-by-step solutions from verified subject matter experts