

Question: Answer these Question: Refer to Tabin 56.1-Factors for Computing Control Chart Limits (3 sigma) for this problem. Sampling 4 pieces of precision-cut wire (to be
Answer these Question: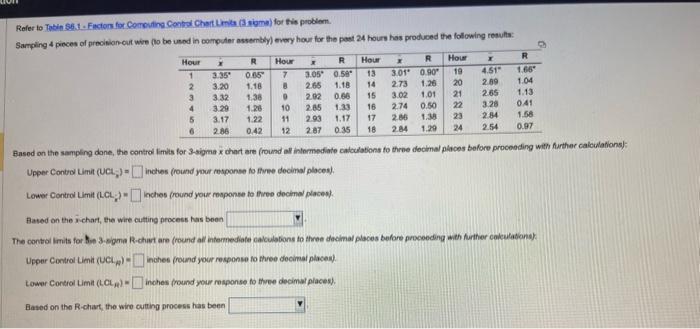
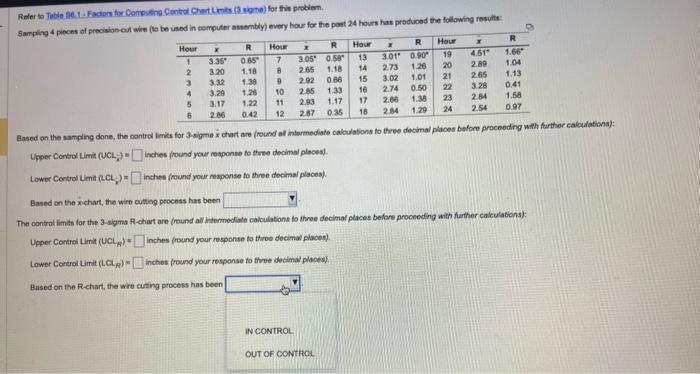
Refer to Tabin 56.1-Factors for Computing Control Chart Limits (3 sigma) for this problem. Sampling 4 pieces of precision-cut wire (to be used in computer assembly) every hour for the past 24 hours has produced the following results: 9 Hour R Hour x R Hour R x Hour R I 1 3.35 0.05 7 3.05 0.58 13 3.01 0.90 19 4.51 1.66 2 3.20 1.18 B 2.65 1.18 14 2.73 1.26 20 2.89 1.04 3 3.32 1.38 2.02 0.66 15 3.02 1.01 21 2.65 1.13 4 3.29 1.26 10 2.85 1.33 16 2.74 0.50 22 3.28 041 5 3.17 1.22 11 2.93 1.17 17 2.86 1.38 23 2.84 1.58 2.86 0.42 12 2.87 0.35 18 2.84 1.29 24 2.54 0.97 Based on the sampling done, the control limits for 3-sigma x chart are (round all intermediate calculations to three decimal places before proceeding with further calculations): Upper Control Limit (UCL) inches (round your response to three decimal places). Lower Control Limit (LCL) inches (round your response to three decimal places). Based on the x-chart, the wire cutting process has been The control limits for the 3-sigma R-chart are (round all intermediate calculations to three decimal places before proceeding with further calculations) Upper Control Limit (UCL)-inches (round your response to three decimal places). Lower Control Limit (LCL) inches (round your response to three decimal places). Based on the R-chart, the wire cutting process has been
Step by Step Solution
There are 3 Steps involved in it

Get step-by-step solutions from verified subject matter experts