

Question: Answer these question using the balance sheet below 2) Write about the assets, liabilities, net worth, revenues, etc. found on your balance sheet. Would you
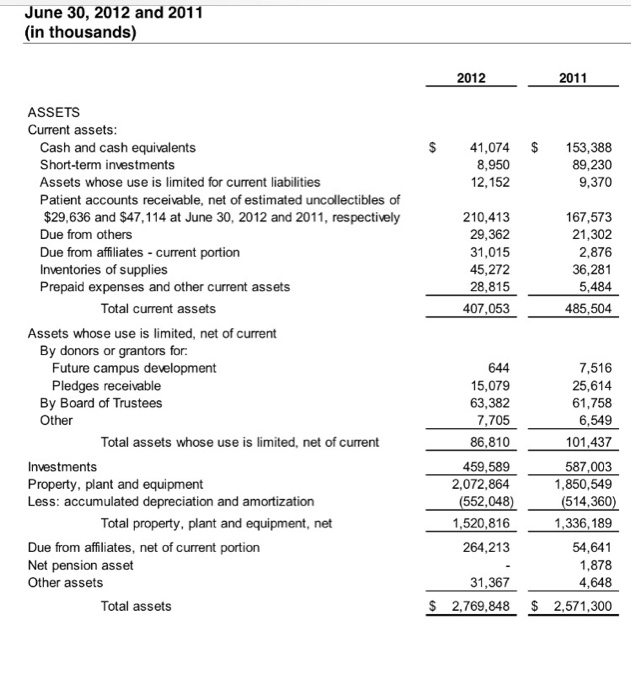
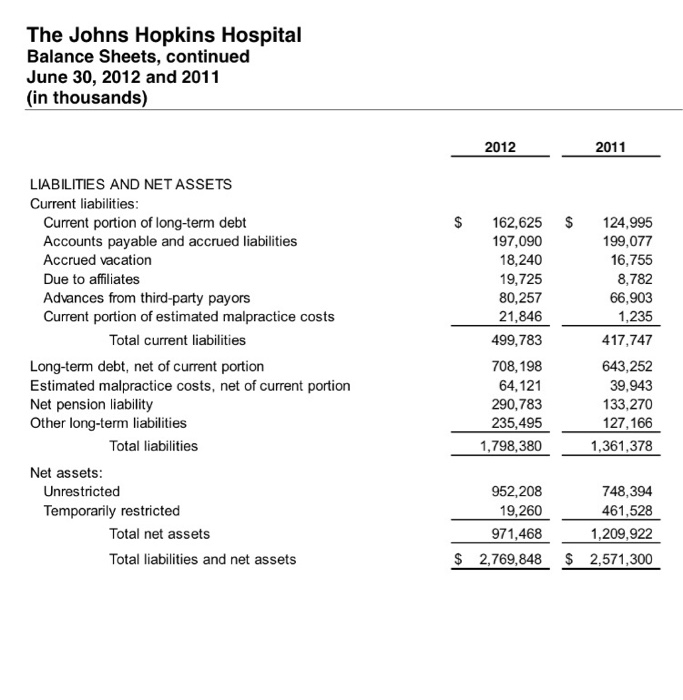
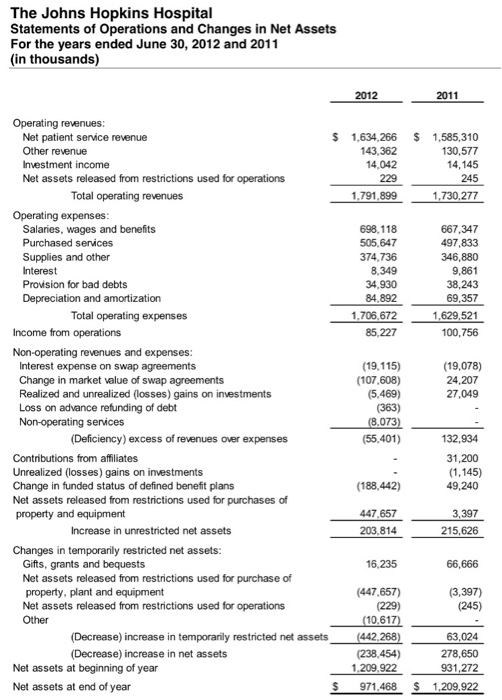
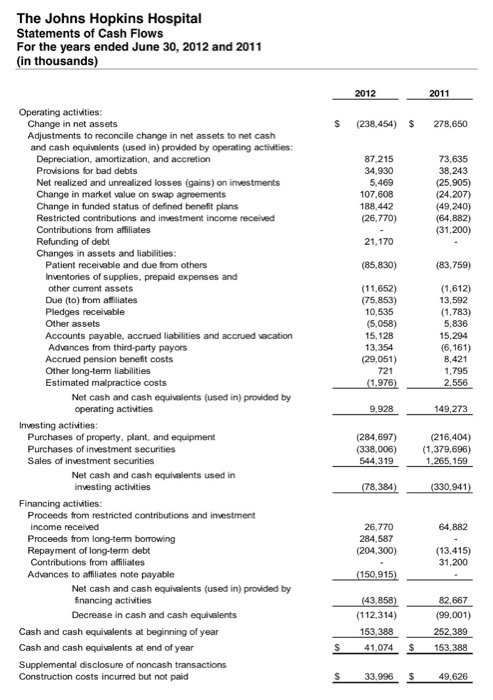
June 30, 2012 and 2011 (in thousands) 2012 2011 ASSETS Current assets Cash and cash equivalents S 41,074 153,388 8,950 Short-term investments 89,230 12,152 Assets whose use is limited for current liabilities 9,370 Patient accounts receivable, net of estimated uncollectibles of $29,636 and $47,114 at June 30, 2012 and 2011, respectively Due from others 210,413 29,362 31,015 45,272 167,573 21,302 2,876 Due from affiliates current portion Inventories of supplies Prepaid expenses and other current assets 36,281 28,815 5,484 Total current assets 407,053 485,504 Assets whose use is limited, net of current By donors or grantors for Future campus development Pledges receivable By Board of Trustees Other 7,516 644 15,079 63,382 7,705 25,614 61,758 6,549 101,437 Total assets whose use is limited, net of current 86,810 459,589 587,003 Investments Property, plant and equipment Less: accumulated depreciation and amortization 2,072,864 1,850,549 (552,048)( 514,360 Total property, plant and equipment, net 1,520,816 1,336,189 54,641 Due from affiliates, net of current portion Net pension asset Other assets 264,213 1,878 4,648 31,367 $ 2,769,848 $ 2,571,300 Total assets The Johns Hopkins Hospital Balance Sheets, continued June 30, 2012 and 2011 (in thousands) 2011 2012 LIABILITIES AND NET ASSETS Current liabilities $ 162,625 S 124,995 Current portion of long-term debt Accounts payable and accrued liabilities 197,090 18,240 99,077 16,755 Accrued vacation Due to affiliates 19,725 80,257 8,782 Advances from third-party payors Currnt portion of estimated malpractice costs Total current liabilities 66,903 21,846 1,235 499,783 417,747 Long-term debt, net of current portion Estimated malpractice costs, net of current portion Net pension liability Other long-term liabilities 708,198 643,252 64,121 39,943 133,270 290,783 235,495 127,166 Total liabilities 1,361,378 1,798,380 Net assets Unrestricted 952,208 748,394 Temporarily restricted 19,260 461,528 Total net assets 971,468 1,209,922 Total liabilities and net assets $ 2,769,848 2,571,300 The Johns Hopkins Hospital Statements of Operations and Changes in Net Assets For the years ended June 30, 2012 and 2011 (in thousands) 2011 2012 Operating revenues Net patient service revenue Other revenue S 1,634,266 S 1,585,310 143,362 14.042 130,577 14,145 Investment income Net assets released from restrictions used for operations 229 245 791.899 Total operating revenues Operating expenses Salaries, wages and beneits Purchased serices 667,347 497,833 698.118 505,647 Supplies and other Interest 374,736 346,880 9,861 38,243 8,349 Provision for bad debts 34,930 Depreciation and amortization 84.892 69,357 Total operating expenses 1,706,672 1,629,521 85,227 100,756 Income from operations Non-operating revenues and expenses: Interest expense on swap agreements Change in market value of swap agreements Realized and unrealized (losses) gains on investments Loss on advance refunding of debt Non-operating serices (19,078) 24,207 (19,115) (107,608) (5,469) (363) 27,049 (Deficiency) excess of revenues over expenses 132,934 (55,401) Contributions from affiliates 31,200 (1,145) 49,240 Unrealized (losses) gains on investments Change in funded status of defined benefit plans Net assets released from restrictions used for purchases of property and equipment (188,442) 447,657 3,397 203,814 215,626 Increase in unrestricted net assets Changes in temporarily restricted net assets: Gifts, grants and bequests Net assets released from restrictions used for purchase of property, plant and equipment Net assets released from restrictions used for operations Other 16,235 66,666 447,657) (229) (3,397) (245) 63,024 (Decrease) increase in temporanily restricted net assets(442.268) (238,454) 278,650 (Decrease) increase in net assets 1209,922931.272 Net assets at beginning of year 931,272 Net assets at end of year S 971,468 S 1,209,922 The Johns Hopkins Hospital Statements of Cash Flows For the years ended June 30, 2012 and 2011 in thousands 2012 2011 Change in net assets Adjustments to reconcile change in net assets to net cash and cash equivalents (used in) provided by operating activities: Depreciation, amortization, and accretion Provisions for bad debts S (238,454) $ 278,650 87,215 73,635 34,930 38,243 Net realized and unrealized losses (gains) on investments Change in market value on swap agreements Change in funded status of defined benefit plans 5.469 (25,905) (24,207) (49,240) (64,882) 107,608 188.442 Restricted contributions and investment income received (26,770) Contributions from affiliates Refunding of debt Changes in assets and liabilities Patient receivable and due from others Inventories of supplies, prepaid expenses and 21.170 (85,830) (83,759) other current assets (75,853) 0,535 Due (to) from afiliates 13,592 (1,783) 5,836 Other assets (5,058) 15,128 Accounts payable, accrued liabilities and accrued vacation Advances from third-party payors Accrued pension benefit costs Other long-term liabilities Estimated malpractice costs 5,294 (6,161) 13,354 (29,051) 721 1,795 976 2,556 Net cash and cash equivalents (used in) provided by operating actiities 149,273 9,928 Imvesting actiities Purchases of property, plant, and equipment Purchases of investment securities Sales of investment securities (284,697) (338,006) (1.379,696) 544 3191.203,199 (216,404) Net cash and cash equivalents used in (78.384) (330.941) nvesting activties Financing activities Proceeds from restricted contributions and investment 64,882 income received 26,770 284,587 Proceeds from long-term borrowing Repayment of long-term debt Contributions from affliates Advances to affiliates note payable (204,300) (13,415) 31,200 50,915) Net cash and cash equivalents (used in) provided by inancing activities (43.858) 82,667 (99.001) Decrease in cash and cash equivalents (112,314) Cash and cash equivalents at beginning of year 153,388252.389 Cash and cash equivalents at end of year 41.074 153,388 Supplemental disclosure of noncash transactions Construction costs incurred but not paid 49.626 3.996 $ June 30, 2012 and 2011 (in thousands) 2012 2011 ASSETS Current assets Cash and cash equivalents S 41,074 153,388 8,950 Short-term investments 89,230 12,152 Assets whose use is limited for current liabilities 9,370 Patient accounts receivable, net of estimated uncollectibles of $29,636 and $47,114 at June 30, 2012 and 2011, respectively Due from others 210,413 29,362 31,015 45,272 167,573 21,302 2,876 Due from affiliates current portion Inventories of supplies Prepaid expenses and other current assets 36,281 28,815 5,484 Total current assets 407,053 485,504 Assets whose use is limited, net of current By donors or grantors for Future campus development Pledges receivable By Board of Trustees Other 7,516 644 15,079 63,382 7,705 25,614 61,758 6,549 101,437 Total assets whose use is limited, net of current 86,810 459,589 587,003 Investments Property, plant and equipment Less: accumulated depreciation and amortization 2,072,864 1,850,549 (552,048)( 514,360 Total property, plant and equipment, net 1,520,816 1,336,189 54,641 Due from affiliates, net of current portion Net pension asset Other assets 264,213 1,878 4,648 31,367 $ 2,769,848 $ 2,571,300 Total assets The Johns Hopkins Hospital Balance Sheets, continued June 30, 2012 and 2011 (in thousands) 2011 2012 LIABILITIES AND NET ASSETS Current liabilities $ 162,625 S 124,995 Current portion of long-term debt Accounts payable and accrued liabilities 197,090 18,240 99,077 16,755 Accrued vacation Due to affiliates 19,725 80,257 8,782 Advances from third-party payors Currnt portion of estimated malpractice costs Total current liabilities 66,903 21,846 1,235 499,783 417,747 Long-term debt, net of current portion Estimated malpractice costs, net of current portion Net pension liability Other long-term liabilities 708,198 643,252 64,121 39,943 133,270 290,783 235,495 127,166 Total liabilities 1,361,378 1,798,380 Net assets Unrestricted 952,208 748,394 Temporarily restricted 19,260 461,528 Total net assets 971,468 1,209,922 Total liabilities and net assets $ 2,769,848 2,571,300 The Johns Hopkins Hospital Statements of Operations and Changes in Net Assets For the years ended June 30, 2012 and 2011 (in thousands) 2011 2012 Operating revenues Net patient service revenue Other revenue S 1,634,266 S 1,585,310 143,362 14.042 130,577 14,145 Investment income Net assets released from restrictions used for operations 229 245 791.899 Total operating revenues Operating expenses Salaries, wages and beneits Purchased serices 667,347 497,833 698.118 505,647 Supplies and other Interest 374,736 346,880 9,861 38,243 8,349 Provision for bad debts 34,930 Depreciation and amortization 84.892 69,357 Total operating expenses 1,706,672 1,629,521 85,227 100,756 Income from operations Non-operating revenues and expenses: Interest expense on swap agreements Change in market value of swap agreements Realized and unrealized (losses) gains on investments Loss on advance refunding of debt Non-operating serices (19,078) 24,207 (19,115) (107,608) (5,469) (363) 27,049 (Deficiency) excess of revenues over expenses 132,934 (55,401) Contributions from affiliates 31,200 (1,145) 49,240 Unrealized (losses) gains on investments Change in funded status of defined benefit plans Net assets released from restrictions used for purchases of property and equipment (188,442) 447,657 3,397 203,814 215,626 Increase in unrestricted net assets Changes in temporarily restricted net assets: Gifts, grants and bequests Net assets released from restrictions used for purchase of property, plant and equipment Net assets released from restrictions used for operations Other 16,235 66,666 447,657) (229) (3,397) (245) 63,024 (Decrease) increase in temporanily restricted net assets(442.268) (238,454) 278,650 (Decrease) increase in net assets 1209,922931.272 Net assets at beginning of year 931,272 Net assets at end of year S 971,468 S 1,209,922 The Johns Hopkins Hospital Statements of Cash Flows For the years ended June 30, 2012 and 2011 in thousands 2012 2011 Change in net assets Adjustments to reconcile change in net assets to net cash and cash equivalents (used in) provided by operating activities: Depreciation, amortization, and accretion Provisions for bad debts S (238,454) $ 278,650 87,215 73,635 34,930 38,243 Net realized and unrealized losses (gains) on investments Change in market value on swap agreements Change in funded status of defined benefit plans 5.469 (25,905) (24,207) (49,240) (64,882) 107,608 188.442 Restricted contributions and investment income received (26,770) Contributions from affiliates Refunding of debt Changes in assets and liabilities Patient receivable and due from others Inventories of supplies, prepaid expenses and 21.170 (85,830) (83,759) other current assets (75,853) 0,535 Due (to) from afiliates 13,592 (1,783) 5,836 Other assets (5,058) 15,128 Accounts payable, accrued liabilities and accrued vacation Advances from third-party payors Accrued pension benefit costs Other long-term liabilities Estimated malpractice costs 5,294 (6,161) 13,354 (29,051) 721 1,795 976 2,556 Net cash and cash equivalents (used in) provided by operating actiities 149,273 9,928 Imvesting actiities Purchases of property, plant, and equipment Purchases of investment securities Sales of investment securities (284,697) (338,006) (1.379,696) 544 3191.203,199 (216,404) Net cash and cash equivalents used in (78.384) (330.941) nvesting activties Financing activities Proceeds from restricted contributions and investment 64,882 income received 26,770 284,587 Proceeds from long-term borrowing Repayment of long-term debt Contributions from affliates Advances to affiliates note payable (204,300) (13,415) 31,200 50,915) Net cash and cash equivalents (used in) provided by inancing activities (43.858) 82,667 (99.001) Decrease in cash and cash equivalents (112,314) Cash and cash equivalents at beginning of year 153,388252.389 Cash and cash equivalents at end of year 41.074 153,388 Supplemental disclosure of noncash transactions Construction costs incurred but not paid 49.626 3.996 $
Step by Step Solution
There are 3 Steps involved in it

Get step-by-step solutions from verified subject matter experts