

Question: ANswer these questions. Question 1. (10 marks) Consider the function z = f(x, y) = x/y. Showing all steps, use the Newton Quotient approach to
ANswer these questions.
Question 1. (10 marks) Consider the function z = f(x, y) = x/y. Showing all steps, use the Newton Quotient approach to find ?z/?y.
Question 2. (5 marks) Let w = xx yx zx . Find the (partial) elasticity of w with respect to x.
Question 3. (5 marks) Let y = 1/x1 + ? x2 with x1 = t3 and x2 = 3t1/3 . (a) Use the chain rule to find dy/dt. (b) Confirm your result by substituting for t and differentiating directly with respect to t.
Question 4. (10 marks) Consider the production function y = f(x1, x2, x3) = A(a1x1-b + a2x2-b + a3x3-b )-1/r .
(a) Find the marginal product functions for x1, x2 and x3. Denote these as MPi , i = 1, 2, 3.
(b) What is the marginal rate of substitution of x2 for x1?
(c) Derive the elasticity of substitution between x2 and x1.
(d) Why is f(x1, x2, x3) called a Constant Elasticity of Substitution (CES) product function?
Question 5. y = f(x1, x2) = x13 ex1x2
a) Find the gradient vector of f(x1, x2). Call this g(x1, x2)
(b) Find the Hessian matrix of f(x1, x2). Call this H(x1, x2)
(c) What does Young's Theorem say about the form of H(x1, x2)?

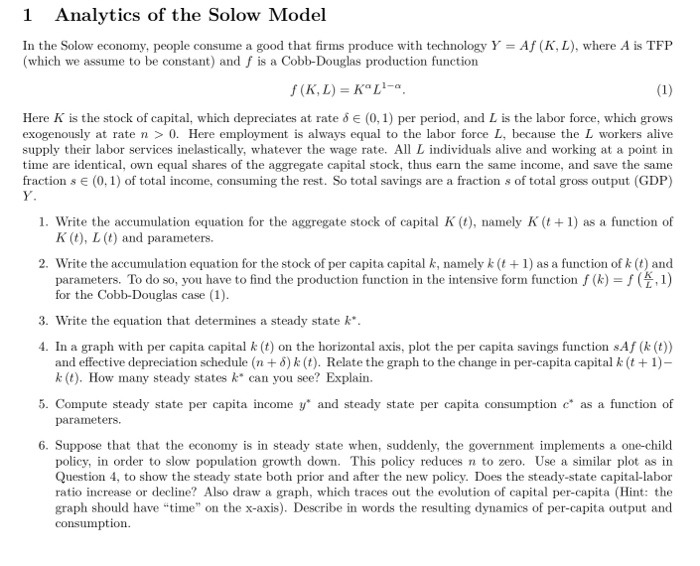
4. After the pandemic is over, the loss of government revenue due to the economic lockdown and the cost of the worker compensation scheme, made government debt soar and the treasury asks you for advice on how to reduce government debt. a) Currently, the citizens of Korona pay a flat tax on labour income of 20% and a proposal by the minister is to increase the tax rate to 30% if income exceeds the threshold of $20,000. Give your assessment of the likely effect of the proposal on labour supply, paying particular attention to the underlying forces at work. Briefly comment on how these forces may affect government revenue. [You can include a graph if it helps to illustrate your reasoning; word limit 250 words; 8 marks]. b) An alternative policy proposes to introduce a tax on inheritances to raise the same amount. Assess the effect on welfare of this inheritance tax allowing for different behavioural responses. [word limit 200 words; 6 marks]. c) Contrast the proposals in a) and b) regarding the potential for off-shore tax evasion. [word limit 200 words; 6 marks].1 Analytics of the Solow Model In the Solow economy, people consume a good that firms produce with technology Y = Af (K, L), where A is TFP (which we assume to be constant) and f is a Cobb-Douglas production function f ( K, L) = KOL-a. (1) Here K is the stock of capital, which depreciates at rate o e (0, 1) per period, and L is the labor force, which grows exogenously at rate n > 0. Here employment is always equal to the labor force L, because the L workers alive supply their labor services inelastically, whatever the wage rate. All L individuals alive and working at a point in time are identical, own equal shares of the aggregate capital stock, thus earn the same income, and save the same fraction s E (0, 1) of total income, consuming the rest. So total savings are a fraction s of total gross output (GDP) Y. 1. Write the accumulation equation for the aggregate stock of capital K (), namely K (t + 1) as a function of K (t), L (t) and parameters. 2. Write the accumulation equation for the stock of per capita capital k, namely k (t + 1) as a function of k (t) and parameters. To do so, you have to find the production function in the intensive form function / (#) = f (7,1) for the Cobb-Douglas case (1). 3. Write the equation that determines a steady state &*. 4. In a graph with per capita capital & (t) on the horizontal axis, plot the per capita savings function sAf (k ()) and effective depreciation schedule (n + 6) k (). Relate the graph to the change in per-capita capital k (t + 1)- k (t). How many steady states k* can you see? Explain. 5. Compute steady state per capita income y" and steady state per capita consumption c* as a function of parameters. 6. Suppose that that the economy is in steady state when, suddenly, the government implements a one-child policy, in order to slow population growth down. This policy reduces n to zero. Use a similar plot as in Question 4, to show the steady state both prior and after the new policy. Does the steady-state capital-labor ratio increase or decline? Also draw a graph, which traces out the evolution of capital per-capita (Hint: the graph should have "time" on the x-axis). Describe in words the resulting dynamics of per-capita output and consumption
Step by Step Solution
There are 3 Steps involved in it

Get step-by-step solutions from verified subject matter experts