

Question: answer these questions showing the steps show all your work leading to the solutions. Work quickly but with care. Show essential steps and formulas for
answer these questions showing the steps
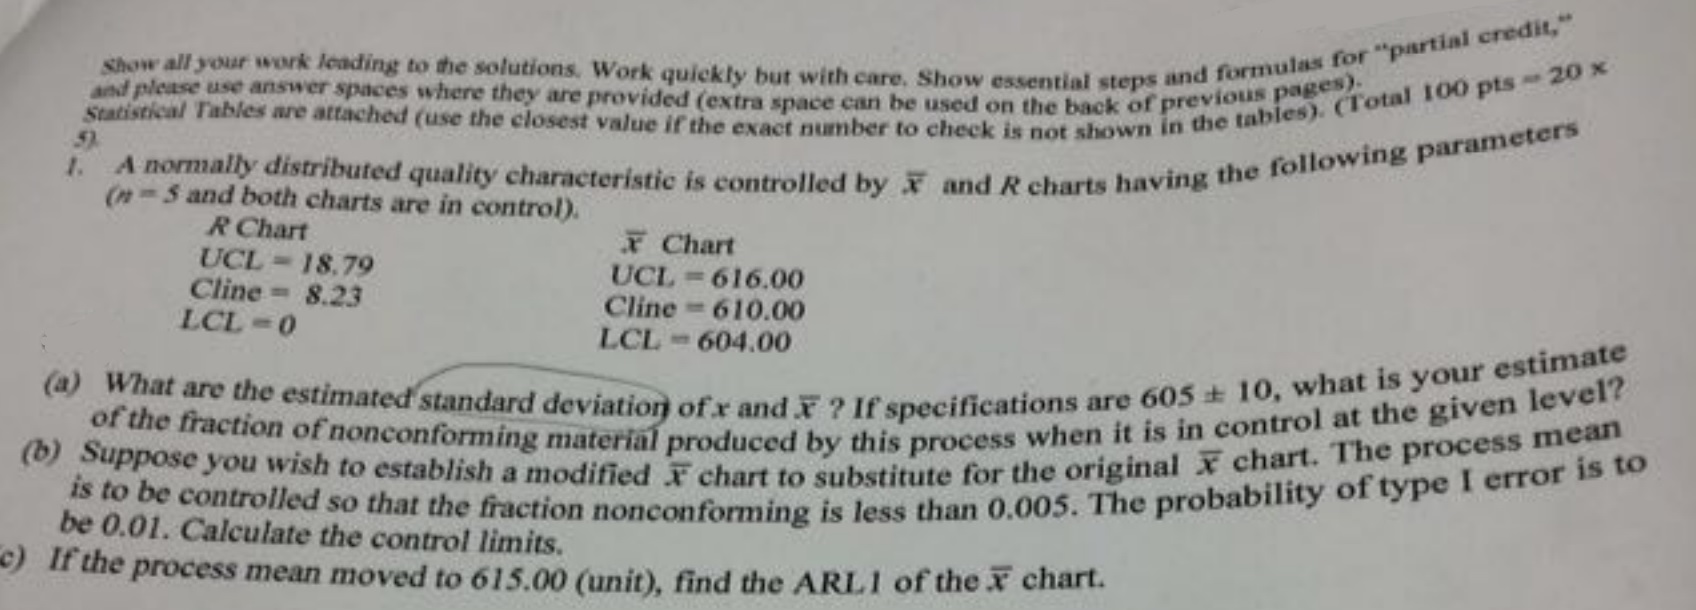
show all your work leading to the solutions. Work quickly but with care. Show essential steps and formulas for "partial credit and please use answer spaces where they are provided (extra space can be used on the back of Sweaty Tables are attached (use the closest value if the exact number to check is not .women in the tables). (Total 100 pts - 20 x of prev previous pages). A normally distributed quality characteristic is controlled by & and R charts having the following parameters (m - 5 and both charts are in control). R Chart * Chart UCL - 18.79 UCL = 616.00 Cline = 8.23 Cline = 610.00 LCL -0 LCL - 604.00 (a) What are the estimated standard deviation of x and X ? If specifications are 605 + 10, what is your estimate of the fraction of nonconforming material produced by this process when it is in control at the given level? (b) Suppose you wish to establish a modified > chart to substitute for the original X chart. The process mean is to be controlled so that the fraction nonconforming is less than 0.005. The probability of type I error is to be 0.01. Calculate the control limits. c) If the process mean moved to 615.00 (unit), find the ARLI of the X chart
Step by Step Solution
There are 3 Steps involved in it

Get step-by-step solutions from verified subject matter experts