

Question: Answer these questions.A) using your scatter diagram, describe the correlation between the number of different plant species and the distance from the lake shoreB) use
Answer these questions.A) using your scatter diagram, describe the correlation between the number of different plant species and the distance from the lake shoreB) use your graphic display calculator to write down:i. The mean of the distances from the lake shore ii. The mean number of plant species (y bar symbol)C) write down the equation of the regression line y on x for the above data D) estimate the number of plant species growing 30 meters from the lake shoreE) is the value in part D) a valid result? Explain why or why not?

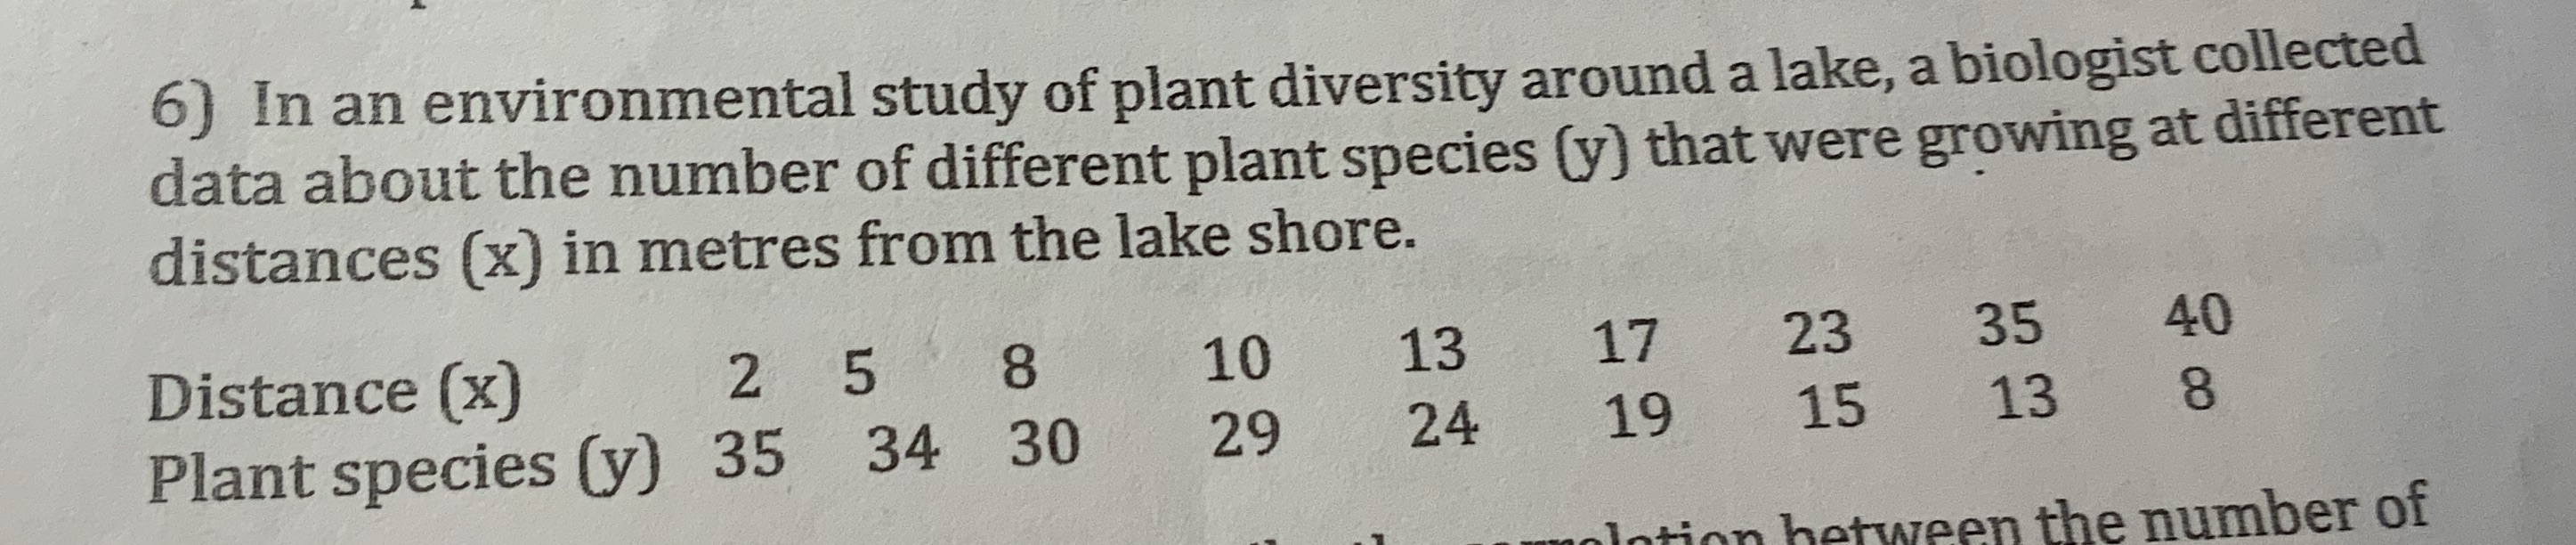
6) In an environmental study of plant diversity around a lake, a biologist collected data about the number of different plant species (y) that were growing at different distances (x) in metres from the lake shore. Distance (x) 2 5 8 10 13 17 23 35 40 Plant species (y) 35 34 30 29 24 19 15 13 8 tween the number of
Step by Step Solution
There are 3 Steps involved in it

Get step-by-step solutions from verified subject matter experts