

Question: (1 point) The Capital Asset Price Model (CAPM) is a financial model that attempts to predict the rate of return on a financial instrument,
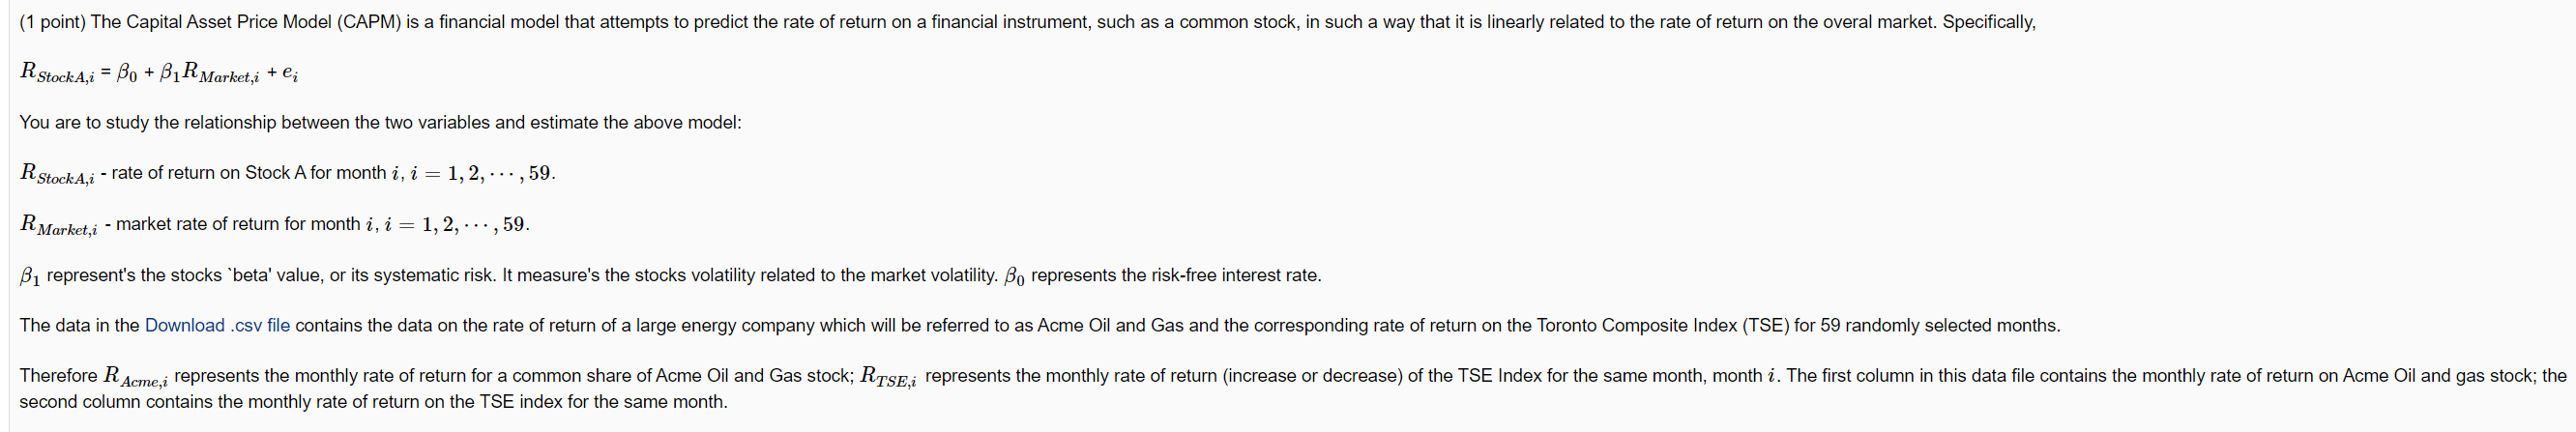
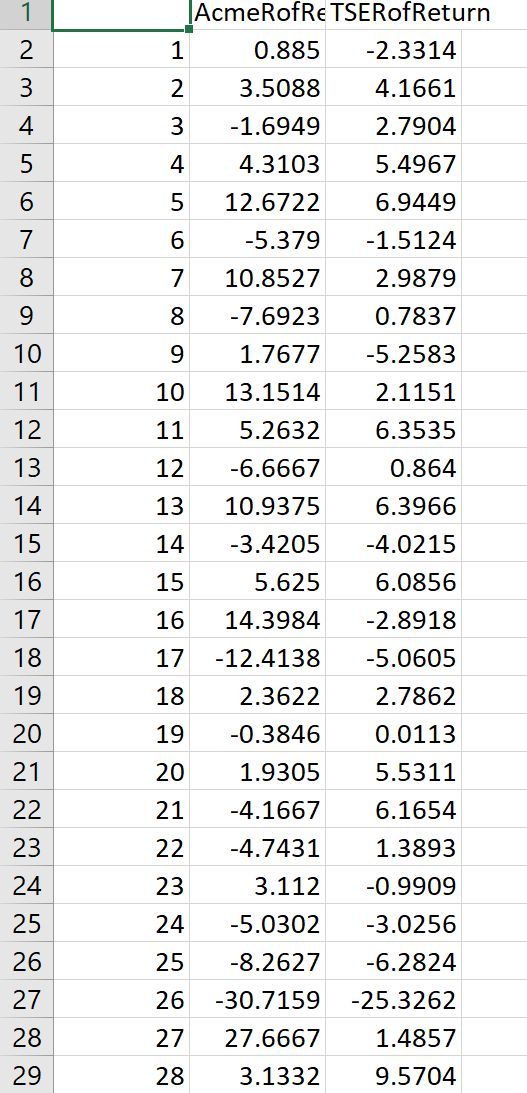
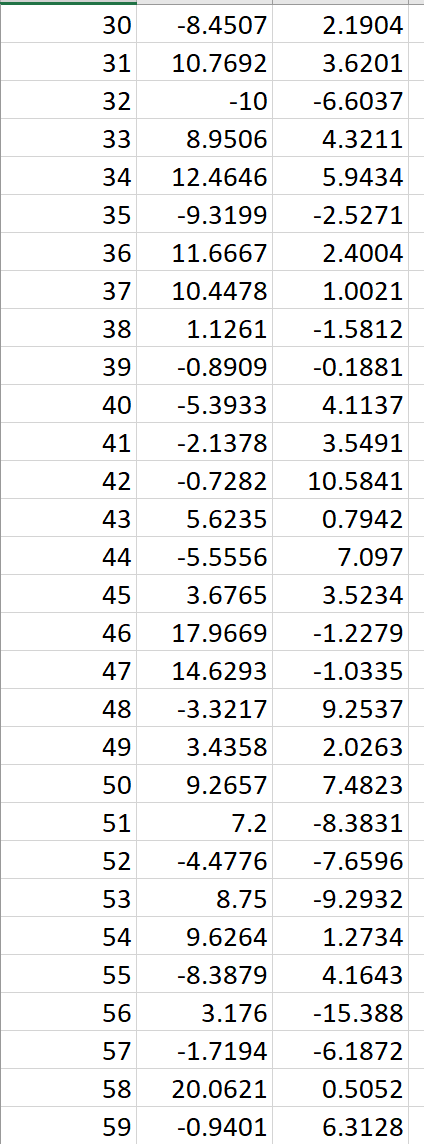
(1 point) The Capital Asset Price Model (CAPM) is a financial model that attempts to predict the rate of return on a financial instrument, such as a common stock, in such a way that it is linearly related to the rate of return on the overal market. Specifically, RStockAi Bo+BR Marketi + ; Ci You are to study the relationship between the two variables and estimate the above model: R Stock A,i - rate of return on Stock A for month i, i 1, 2,..., 59. = = 1, 2, ., 59. RMarket,i - market rate of return for month i, i 1 represent's the stocks 'beta' value, or its systematic risk. It measure's the stocks volatility related to the market volatility. Bo represents the risk-free interest rate. The data in the Download .csv file contains the data on the rate of return of a large energy company which will be referred to as Acme Oil and Gas and the corresponding rate of return on the Toronto Composite Index (TSE) for 59 randomly selected months. Therefore R Acme,i represents the monthly rate of return for a common share of Acme Oil and Gas stock; RTSE, represents the monthly rate of return (increase or decrease) of the TSE Index for the same month, month i. The first column in this data file contains the monthly rate of return on Acme Oil and gas stock; the second column contains the monthly rate of return on the TSE index for the same month. 123 + 1 AcmeRofRE TSERofReturn 0.885 -2.3314 2 3.5088 4.1661 4 3 -1.6949 2.7904 5 4 4.3103 5.4967 69 5 12.6722 6.9449 7 6 -5.379 -1.5124 800 8 7 10.8527 2.9879 9 8 -7.6923 0.7837 10 9 1.7677 -5.2583 11 10 13.1514 2.1151 12 11 5.2632 6.3535 13 12 -6.6667 0.864 14 13 10.9375 6.3966 15 14 -3.4205 -4.0215 62622222222222 16 17 18 19 15 5.625 6.0856 16 14.3984 -2.8918 17 -12.4138 -5.0605 18 2.3622 2.7862 20 19 -0.3846 0.0113 21 20 1.9305 5.5311 21 -4.1667 6.1654 23 22 -4.7431 1.3893 24 23 3.112 -0.9909 25 24 -5.0302 -3.0256 27 28 27 27.6667 1.4857 29 28 3.1332 9.5704 25 -8.2627 -6.2824 26 -30.7159 -25.3262 30 -8.4507 2.1904 31 10.7692 3.6201 32 -10 -6.6037 33 8.9506 4.3211 34 12.4646 5.9434 35 -9.3199 -2.5271 36 11.6667 2.4004 37 10.4478 1.0021 38 1.1261 -1.5812 39 -0.8909 -0.1881 40 -5.3933 4.1137 41 -2.1378 3.5491 42 -0.7282 10.5841 43 5.6235 0.7942 44 -5.5556 7.097 45 3.6765 3.5234 46 17.9669 -1.2279 47 14.6293 -1.0335 48 -3.3217 9.2537 49 3.4358 2.0263 50 9.2657 7.4823 51 7.2 -8.3831 52 -4.4776 -7.6596 53 8.75 -9.2932 54 9.6264 1.2734 55 -8.3879 4.1643 56 3.176 -15.388 57 -1.7194 -6.1872 58 20.0621 0.5052 59 -0.9401 6.3128 (a) Using R-Studio, create a scatter-plot of the data. What can you conclude from this scatter-plot? A. There is not a linear relationship between the monthly rate of return of Acme stock and the monthly rate of return of the TSE Index. OB. There is a positive linear relationship between the monthly rate of return of Acme Oil and Gas stock and the monthly rate of return of the TSE Index. C. There is a negative linear relationship between the monthly rate of return of Acme stock and the monthly rate of return of the TSE Index. (b) Find the value of the correlation coefficient. Enter your answer using four decimals. (c) Use R-Studio to find the least squares estimate of the linear model that expressed the monthly rate of return on Acme Oil and Gas stock as a linear functino of the monthly rate of return on the Toronto Stock Exchange Index. Use three decimals in each of your answers. T = R Acme,i = + RTSE,i (d) The rate of return on the TSE Index for the month of October was -3.42%. Predict the monthly rate of return of Acme Oil and Gas stock for the month of October. Use four decimals in your answer. R Acme,Oct % (e) Interpret the meaning of the predicted value in (d) in the context of the data. If the monthly rate of return of the TSE Index is -3.42%, the ? of Acme Oil and Gas stock is (f) Find the coefficient of determination. Expresses as a percentage, and use two decimal places in your answer. 12 % # (g) In the context of the data, interpret the meaning of the coefficient of determination. A. The percentage found above is the percentage of variation in the monthly rate of return of Acme stock that can be explained by its linear relationship with the monthly rate of return of the TSE Index. B. There is a weak, positive linear relationship between the monthly rate of return of Acme stock and the monthly rate of return of the TSE Index. C. The percentage found above is the percentage of variation in the monthly rate of return of the TSE Index that can be explained by its linear dependency with the monthly rate of return of Acme stock. D. There is a strong, positive linear relationship between the monthly rate of return of Acme stock and the monthly rate of return of the TSE Index. (h) Find the residual corresponding to the data point found in the 10th row of the data file. Use four decimals in your answer. e10
Step by Step Solution
There are 3 Steps involved in it
Lets go through the steps of the problem using the given data a Scatter Plot and Summary To create a ... View full answer

Get step-by-step solutions from verified subject matter experts