

Question: Answer this question using MINITAB State Ho and Ha, the P value, the X2 value, and if we reject or fail to reject the hypothesis
Answer this question using MINITAB
State Ho and Ha, the P value, the X2 value, and if we reject or fail to reject the hypothesis and why!
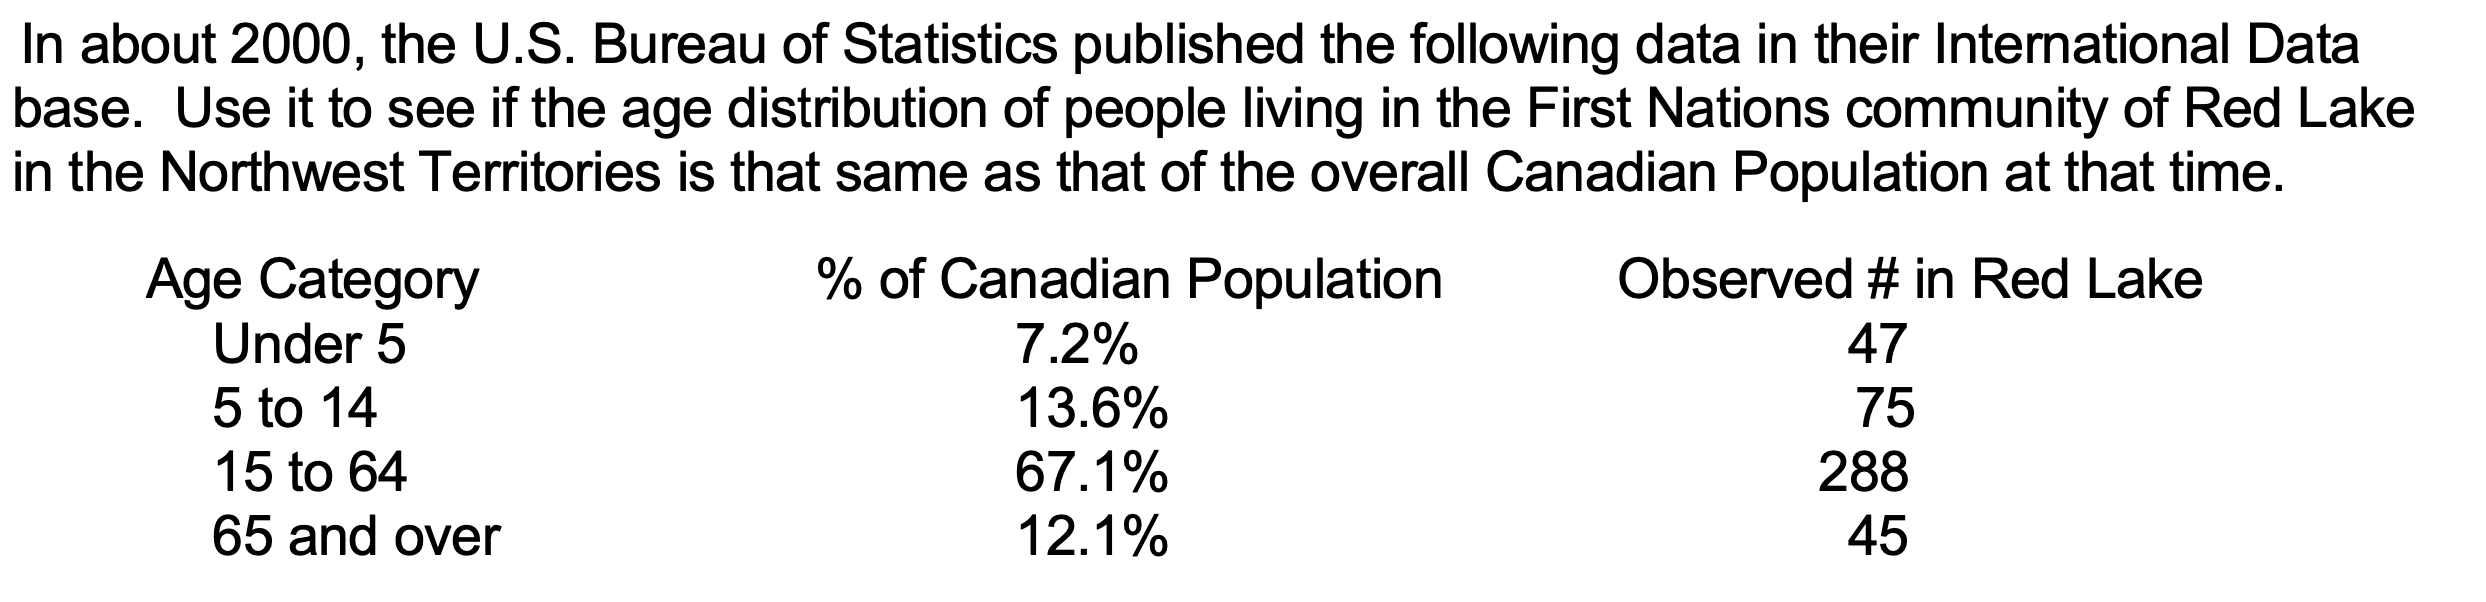
In about 2000, the U.S. Bureau of Statistics published the following data in their International Data base. Use it to see if the age distribution of people living in the First Nations community of Red Lake in the Northwest Territories is that same as that of the overall Canadian Population at that time. Age Category % of Canadian Population Observed # in Red Lake Under 5 7.2% 47 5 to 14 13.6% 75 15 to 64 67.1% 288 65 and over 12.1% 45
Step by Step Solution
There are 3 Steps involved in it
1 Expert Approved Answer
Step: 1 Unlock

Question Has Been Solved by an Expert!
Get step-by-step solutions from verified subject matter experts
Step: 2 Unlock
Step: 3 Unlock