

Question: answer this Which of the following graphs represents the solution set of the inequality 5 y
answer this
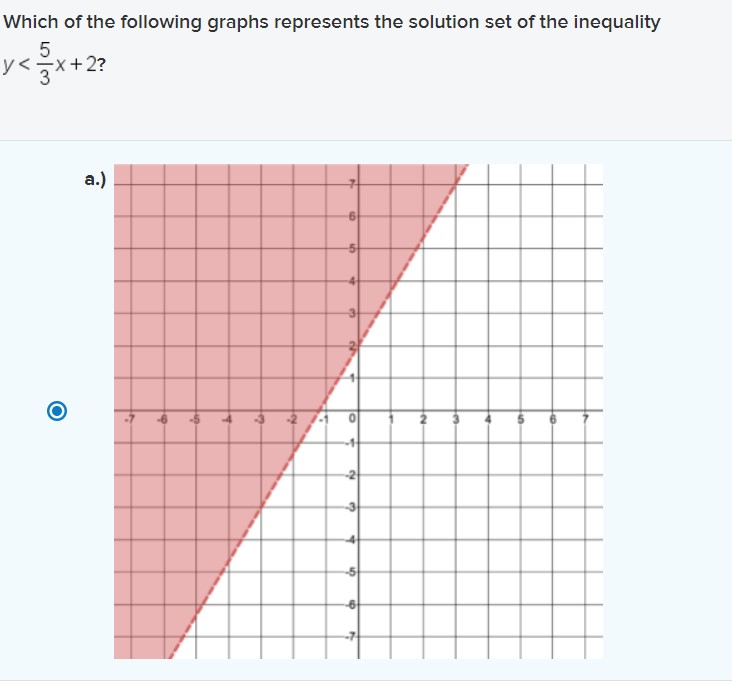
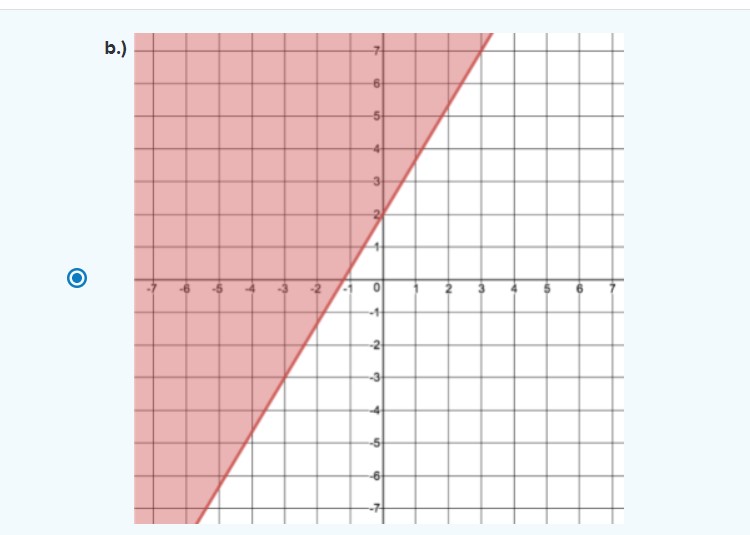
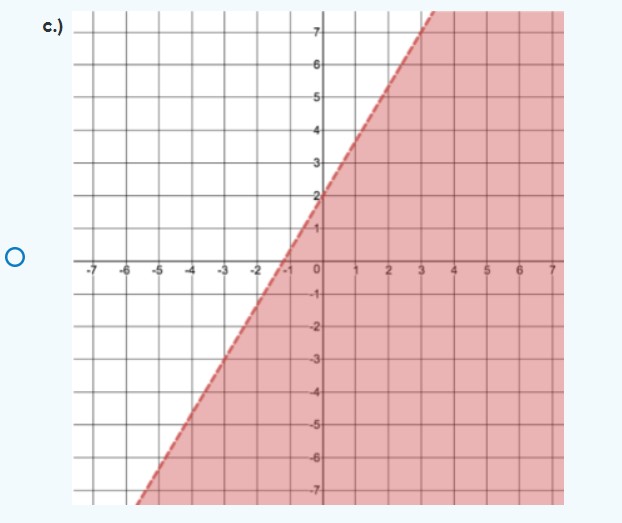

Which of the following graphs represents the solution set of the inequality 5 y
Step by Step Solution
There are 3 Steps involved in it
1 Expert Approved Answer
Step: 1 Unlock

Question Has Been Solved by an Expert!
Get step-by-step solutions from verified subject matter experts
Step: 2 Unlock
Step: 3 Unlock