

Question: Answer this with graph ASAP The data you need for this project are on the last three pages. There aru chree sets of data given
Answer this with graph ASAP 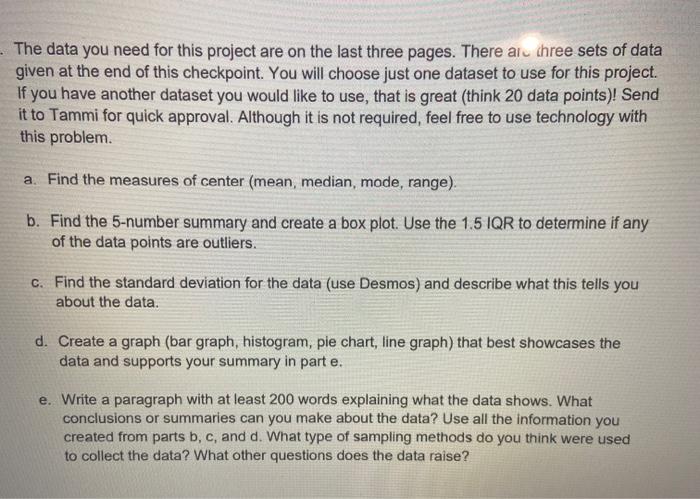
The data you need for this project are on the last three pages. There aru chree sets of data given at the end of this checkpoint. You will choose just one dataset to use for this project. If you have another dataset you would like to use, that is great (think 20 data points)! Send it to Tammi for quick approval. Although it is not required, feel free to use technology with this problem a. Find the measures of center (mean, median, mode, range). b. Find the 5-number summary and create a box plot. Use the 1.5 IQR to determine if any of the data points are outliers. C. Find the standard deviation for the data (use Desmos) and describe what this tells you about the data. d. Create a graph (bar graph, histogram, pie chart, line graph) that best showcases the data and supports your summary in parte. e. Write a paragraph with at least 200 words explaining what the data shows. What conclusions or summaries can you make about the data? Use all the information you created from parts b, c, and d. What type of sampling methods do you think were used to collect the data? What other questions does the data raise? The data you need for this project are on the last three pages. There aru chree sets of data given at the end of this checkpoint. You will choose just one dataset to use for this project. If you have another dataset you would like to use, that is great (think 20 data points)! Send it to Tammi for quick approval. Although it is not required, feel free to use technology with this problem a. Find the measures of center (mean, median, mode, range). b. Find the 5-number summary and create a box plot. Use the 1.5 IQR to determine if any of the data points are outliers. C. Find the standard deviation for the data (use Desmos) and describe what this tells you about the data. d. Create a graph (bar graph, histogram, pie chart, line graph) that best showcases the data and supports your summary in parte. e. Write a paragraph with at least 200 words explaining what the data shows. What conclusions or summaries can you make about the data? Use all the information you created from parts b, c, and d. What type of sampling methods do you think were used to collect the data? What other questions does the data raise
Step by Step Solution
There are 3 Steps involved in it
1 Expert Approved Answer
Step: 1 Unlock

Question Has Been Solved by an Expert!
Get step-by-step solutions from verified subject matter experts
Step: 2 Unlock
Step: 3 Unlock